ESP32-S3 + GC9A01 Round Display + BMP180 | DIY Mountain Altitude Logger Tutorial (SPI + I2C + Arduino)
Drive a GC9A01 1.28-inch round color display with an ESP32-S3, paired with a BMP180 barometric pressure sensor, to build a hiking altitude logger with a dynamic mountain background, real-time altitude, total ascent/descent, and pressure readout. Includes the full Arduino code and wiring guide.
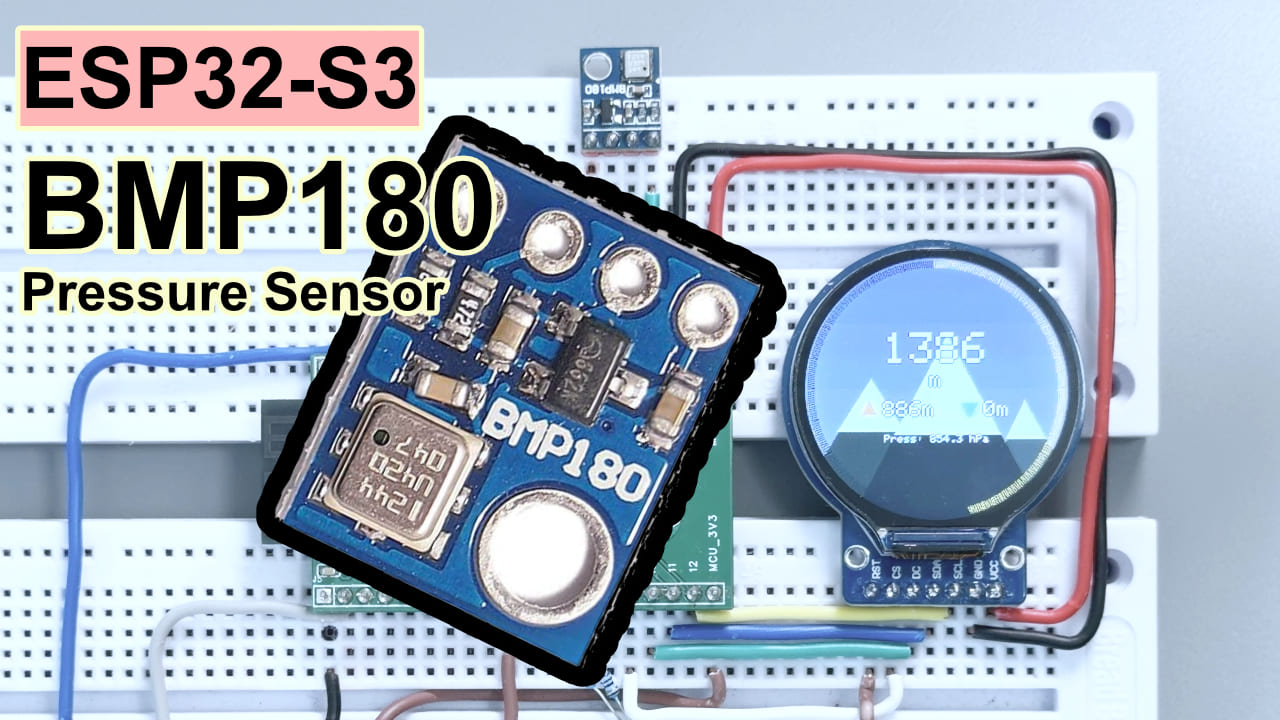
Difficulty: ⭐⭐⭐☆☆ (if you’ve soldered a few Dupont jumpers, you’re ready) Estimated time: 45 minutes Tested with: Arduino IDE 2.3.8 · Arduino_GFX_Library v1.6.5 · Adafruit BMP085 Library v1.2.4 · ESP32 Arduino Core 3.3.10
TL;DR (quick start):
- Wire the display: GC9A01 → CS/GPIO9, DC/GPIO10, SCK/GPIO12, MOSI/GPIO11, RST/GPIO18, BL/GPIO7
- Wire the sensor: BMP180 → SDA/GPIO13, SCL/GPIO14
- Backlight must be pulled HIGH: add
digitalWrite(TFT_BL, HIGH)insetup(). Without this line the screen stays black forever.- Install two libraries: Arduino_GFX_Library (by moononournation) + Adafruit BMP085 Library
- Flash it, open the Serial Monitor (115200), and when you see
Initialization complete, entering main loopyou’re done.
Introduction
I love hiking, but lately the only mountain I can get to is Baiyun Mountain. My backpack is stuffed with a power bank, phone, and sunscreen — yet nothing that can tell me in real time “how many meters you’ve climbed.” Phone apps need a network connection, GPS signal is hit or miss, and every time I pull out my phone it feels like “I’m just here to snap a check-in photo.” So I decided to build my own hiking altitude logger.
When I got home and dug through my parts bin, I found a GC9A01 round display that had been gathering dust for ages — that circular outline looks just like a watch face on an altimeter watch. Paired with a BMP180 barometric sensor and an ESP32-S3, three parts totaling less than the equivalent of around 50 RMB, and the result came out way better than I expected.
Goal of this article: from scratch, wire these three parts together, flash the code, and end up with a hiking logger that shows real-time altitude, total ascent/descent, and pressure, with a background that shifts color dynamically as you climb. Follow along and you can reproduce it.
Result
The finished build: the GC9A01 round display shows real-time altitude (m), total ascent (orange up arrow), total descent (blue down arrow), and live pressure. The background is a mountain landscape whose colors change dynamically with your altitude ratio — warm brown at low altitudes, gradually shifting to deep blue higher up, and the snow line on the peaks creeps lower as you gain elevation. A gold progress ring around the edge of the screen tracks your altitude progress, and a 2-second long press of the BOOT button zeroes everything out to start fresh.
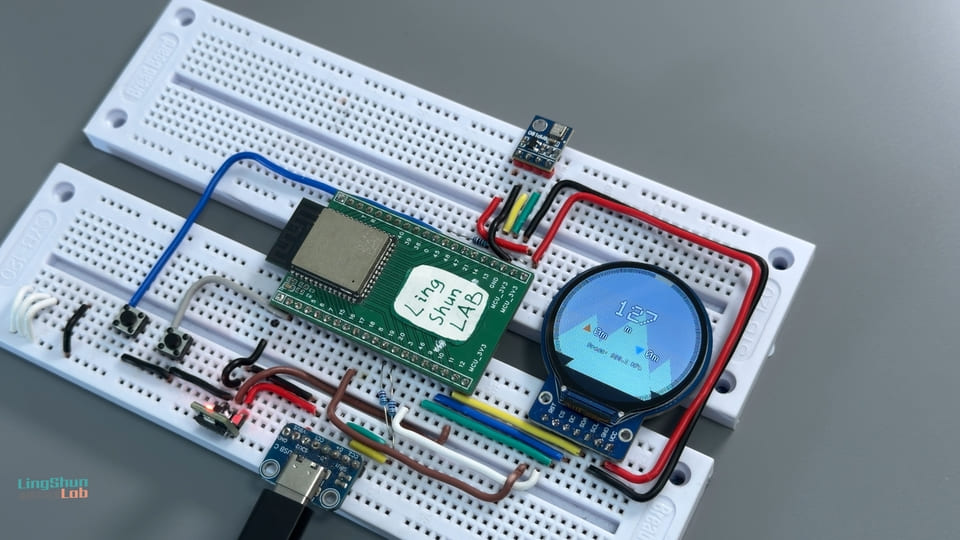
Component overview
The ESP32-S3 dev board needs no introduction — if you’re reading this, you’ve used an ESP32. Below I’ll only cover the other two supporting players.
BMP180 barometric pressure sensor
The BMP180 is a MEMS barometric pressure sensor. Its job is to measure atmospheric pressure and derive altitude, and in this project it samples pressure and altitude once per second as the data source for the entire dashboard.
In plain terms: think of it as a pocket-sized mini weather station — by measuring atmospheric pressure it back-calculates how high you’re standing. The principle is the same thing that makes your ears feel stuffed during a plane’s takeoff and landing: lower pressure means higher altitude. Because temperature affects pressure readings, it also integrates a temperature sensor internally to help correct the data and make the altitude more accurate.
| Parameter | Value |
|---|---|
| Operating voltage | 1.8 V – 3.6 V (just connect 3.3 V) |
| Communication protocol | I2C (fixed address 0x77) |
| Pressure range | 300 – 1100 hPa |
| Altitude accuracy | ±1 m in standard mode, ±0.5 m in high-accuracy mode |
| Operating current | 0.1 µA standby; 650 µA peak (during conversion); 3–32 µA avg at 1 Hz (mode-dependent) |
Why pick it: the module is cheap, the Adafruit library support is solid, and the accuracy is more than enough for hiking logs. If you need higher accuracy or humidity data, you can upgrade to the BMP280 or BME280, but that’s a topic for another article.
GC9A01 round TFT color display
The GC9A01 is the driver IC behind a 1.28-inch round TFT color display. It receives SPI data and drives a 240×240 pixel circular panel, and in this project it renders the dynamic mountain background and the real-time altitude data.
In plain terms: picture the round watch face of a smartwatch — that’s exactly this. It talks over SPI, has a fast refresh rate, and the circular form factor is a natural fit for a dashboard. Combined with the Canvas double-buffering from Arduino_GFX_Library, animations come out buttery smooth with no flicker.
| Parameter | Value |
|---|---|
| Display size | 1.28 inch (round) |
| Resolution | 240 × 240 pixels |
| Driver IC | GC9A01 |
| Communication interface | SPI (up to 80 MHz) |
| Operating voltage | 3.3 V |
| Color depth | 16-bit RGB565 (65536 colors) |
Why pick it: a round display and the “altimeter watch” theme are a match made in heaven. The diameter is just large enough to fit the big altitude digits, the ascent/descent indicators, and the progress ring without feeling cramped.
BOM
| Component | Model / Spec | Qty |
|---|---|---|
| Main controller board | ESP32-S3 (a USB-C version is recommended) | 1 |
| Barometric pressure sensor | BMP180 module (a finished module with I2C pull-up resistors) | 1 |
| Round color display | GC9A01 1.28-inch TFT, 240×240 | 1 |
| Jumper wires | Dupont wires (female-to-female) | a handful |
| Power | USB-C data cable + computer / USB charger | 1 |
Pin reference
GC9A01 pins
| Display pin | Function |
|---|---|
| VCC | Power positive, connect to 3.3 V |
| GND | Power ground |
| SCL / CLK | SPI clock line |
| SDA / MOSI | SPI data line (master → slave) |
| CS | Chip select (active low) |
| DC | Data / command select line |
| RST | Reset (triggered by low level) |
| BL | Backlight control, HIGH to light up |
BMP180 pins
| Sensor pin | Function |
|---|---|
| VCC | Power positive, connect to 3.3 V |
| GND | Power ground |
| SCL | I2C clock line |
| SDA | I2C data line |
Wiring
GC9A01 → ESP32-S3
| GC9A01 pin | ESP32-S3 GPIO |
|---|---|
| VCC | 3.3 V |
| GND | GND |
| SCL / CLK | GPIO 12 |
| SDA / MOSI | GPIO 11 |
| CS | GPIO 9 |
| DC | GPIO 10 |
| RST | GPIO 18 |
| BL (backlight) | GPIO 7 |
BMP180 → ESP32-S3
| BMP180 pin | ESP32-S3 GPIO |
|---|---|
| VCC | 3.3 V |
| GND | GND |
| SCL | GPIO 14 |
| SDA | GPIO 13 |
After wiring, double-check every connection one by one — it eliminates 80% of debugging time. Two spots are particularly easy to get wrong: first, wiring BL (backlight) to GPIO7 isn’t enough — the code also needs
digitalWrite(TFT_BL, HIGH)for it to actually light up; second, the GC9A01’s SCL/SDA run over SPI, while the BMP180’s SCL/SDA run over I2C. The names are the same, but they are two completely independent buses and the pins must never be mixed up.
Required libraries
Open Arduino IDE → Tools → Manage Libraries, search for and install the following three:
| Library | Author | Purpose |
|---|---|---|
| Arduino_GFX_Library | moononournation | GC9A01 display driver + Canvas double-buffered rendering |
| Adafruit BMP085 Library | Adafruit | BMP180 / BMP085 barometric sensor driver |
| Adafruit Unified Sensor | Adafruit | Dependency of the library above, install it together |
Verified working versions: Arduino_GFX_Library v1.6.5 · Adafruit BMP085 Library v1.2.4 · Arduino IDE 2.3.8 · ESP32 Arduino Core 3.3.10 If you’re on an older ESP32 Core (the 1.x series), some of the SPI initialization differs slightly. It’s recommended to just upgrade to 3.x and save yourself the headaches.
Full code
/*
  ============================================================
  Mountain Altitude Logger
  ============================================================
  Hardware: ESP32-S3 + GC9A01 round display (240x240) + BMP180 barometric sensor
  ============================================================
*/

#include <Arduino_GFX_Library.h>
#include <Wire.h>
#include <Adafruit_BMP085.h>

// ===================== Step 1: Pin and parameter definitions =====================
#define TFT_CS    9    // TFT chip select
#define TFT_DC    10   // Data/command select
#define TFT_SCK   12   // SPI clock
#define TFT_MOSI  11   // SPI data (master -> slave)
#define TFT_RST   18   // TFT reset
#define TFT_BL    7    // Backlight control (HIGH to light up, must be pulled HIGH!)
#define TFT_MISO  -1   // No MISO needed (write-only, never read from the display)

#define BMP_SDA   13   // BMP180 I2C data line
#define BMP_SCL   14   // BMP180 I2C clock line

#define BTN_PIN   0    // Built-in BOOT button, long-press 2s to zero/recalibrate
#define CALIBRATION_HOLD_MS 2000  // Long-press trigger threshold (ms)

#define FILTER_SIZE 5     // Sliding average filter window (average of the last 5 samples)
#define DEAD_ZONE   0.3f  // Dead zone for total ascent/descent (ignore jitter below 0.3m)
#define ALT_RANGE_MAX 3000.0f  // Altitude ceiling corresponding to a full progress ring (3000m)

// ===================== Step 2: Hardware driver objects =====================
Arduino_DataBus *bus = new Arduino_ESP32SPI(TFT_DC, TFT_CS, TFT_SCK, TFT_MOSI, TFT_MISO);
Arduino_GFX *gfx = new Arduino_GC9A01(bus, TFT_RST, 0 /* rotation */, true /* IPS mode */);
// Canvas double buffering: all drawing is first written to an in-memory canvas, then flush() pushes it to the screen in one shot, eliminating flicker
Arduino_Canvas *canvas = new Arduino_Canvas(240, 240, gfx);

Adafruit_BMP085 bmp;

// ===================== Step 3: Data structures =====================
struct AltitudeData {
  float currentAltitude = 0;       // Current altitude (after filtering)
  float maxAltitude = 0;           // Maximum altitude for this session
  float totalAscent = 0;           // Total ascent
  float totalDescent = 0;          // Total descent
  float currentPressure = 1013.25; // Current pressure (hPa)

  // The "displayed values" below are used for animation interpolation, so digits transition smoothly instead of jumping abruptly
  float displayedAltitude = 0;
  float displayedAscent = 0;
  float displayedDescent = 0;
  float displayedPressure = 1013.25;
} data;

// Ring buffer used by the sliding average filter
float altBuffer[FILTER_SIZE] = {0};
int filterIndex = 0;
int filterCount = 0;

// Color constants (initialized with color565() in setup() to avoid allocating resources too early)
uint16_t COLOR_WHITE, COLOR_BLACK, COLOR_CREAM_GREEN;

// Button state
unsigned long btnPressStart = 0;
bool btnIsPressed = false;
bool calibrationTriggered = false;


// ============================================================
//                   Module 1: Sensor reading
// ============================================================

void initSensor() {
  Serial.print("[Sensor] Initializing I2C bus (SDA=");
  Serial.print(BMP_SDA);
  Serial.print(", SCL=");
  Serial.print(BMP_SCL);
  Serial.println(")...");

  Wire.begin(BMP_SDA, BMP_SCL);

  Serial.println("[Sensor] Connecting to BMP180 sensor...");
  if (!bmp.begin()) {
    // If the program gets stuck printing ERROR here, the sensor wiring has a problem.
    // The screen won't light up either, because execution never reaches the code below.
    while (1) {
      Serial.println("[ERROR] BMP180 initialization failed! Check wiring, power (3.3V), and I2C pins.");
      delay(2000);
    }
  }
  Serial.println("[Sensor] BMP180 connected successfully!");
}

// Read one raw pressure and altitude sample from the BMP180
void sampleSensor(float &rawAltitude, float &rawPressure) {
  rawPressure = bmp.readPressure() / 100.0f;  // Pa to hPa
  rawAltitude = bmp.readAltitude(101325);      // 101325 Pa = standard sea-level pressure
}


// ============================================================
//                   Module 2: Data processing
// ============================================================

// Sliding average filter: averages the last FILTER_SIZE readings to reduce sensor noise
float smoothAltitude(float raw) {
  altBuffer[filterIndex] = raw;
  filterIndex = (filterIndex + 1) % FILTER_SIZE;
  if (filterCount < FILTER_SIZE) filterCount++;

  float sum = 0;
  for (int i = 0; i < filterCount; i++) sum += altBuffer[i];
  return sum / filterCount;
}

// Update statistics: max altitude, total ascent, total descent
void updateStats(float smoothedAltitude) {
  static bool firstSample = true;
  static float lastAltitude = 0;

  if (firstSample) {
    lastAltitude = smoothedAltitude;
    data.maxAltitude = smoothedAltitude;
    firstSample = false;
  }

  float delta = smoothedAltitude - lastAltitude;
  // Only count changes above the dead zone, so tiny jitter on flat ground doesn't inflate the ascent number
  if (delta > DEAD_ZONE) {
    data.totalAscent += delta;
  } else if (delta < -DEAD_ZONE) {
    data.totalDescent += -delta;
  }

  if (smoothedAltitude > data.maxAltitude) {
    data.maxAltitude = smoothedAltitude;
  }

  lastAltitude = smoothedAltitude;
  data.currentAltitude = smoothedAltitude;
}


// ============================================================
//                   Module 3: Button and calibration
// ============================================================

void showCalibrationFlash();  // Forward declaration

// Triggered by a long press of BOOT: zero ascent/descent and restart from the current altitude as the new baseline
void doCalibration() {
  Serial.println("[Button] Long press detected, zeroing altitude calibration...");
  data.totalAscent = 0;
  data.totalDescent = 0;
  data.displayedAscent = 0;
  data.displayedDescent = 0;
  data.maxAltitude = data.currentAltitude;

  showCalibrationFlash();
  Serial.println("[Button] Calibration complete.");
}

// Detect button state, the BOOT button is active-low
void handleButton() {
  bool pressed = (digitalRead(BTN_PIN) == LOW);

  if (pressed && !btnIsPressed) {
    btnIsPressed = true;
    btnPressStart = millis();
    calibrationTriggered = false;
  } else if (pressed && btnIsPressed) {
    // Hold longer than the threshold and not yet triggered -> run calibration
    if (!calibrationTriggered && (millis() - btnPressStart >= CALIBRATION_HOLD_MS)) {
      doCalibration();
      calibrationTriggered = true;  // Prevent repeated triggers during a single long press
    }
  } else if (!pressed && btnIsPressed) {
    btnIsPressed = false;
  }
}


// ============================================================
//                   Module 4: UI rendering
// ============================================================

// Linear interpolation between two RGB565 colors (t from 0.0 to 1.0)
uint16_t lerpColor(uint16_t colorA, uint16_t colorB, float t) {
  t = constrain(t, 0.0, 1.0);
  uint8_t r1 = (colorA >> 11) & 0x1F, g1 = (colorA >> 5) & 0x3F, b1 = colorA & 0x1F;
  uint8_t r2 = (colorB >> 11) & 0x1F, g2 = (colorB >> 5) & 0x3F, b2 = colorB & 0x1F;
  uint8_t r = r1 + (r2 - r1) * t;
  uint8_t g = g1 + (g2 - g1) * t;
  uint8_t b = b1 + (b2 - b1) * t;
  return (r << 11) | (g << 5) | b;
}

// Draw a gradient sky background: warm brown at low altitude, fading to deep blue at high altitude
void drawSkyBackground(float altitudeRatio) {
  uint16_t topLow     = canvas->color565(176, 196, 210);  // Low-altitude zenith: pale blue
  uint16_t topHigh    = canvas->color565(30, 30, 90);     // High-altitude zenith: deep blue
  uint16_t bottomLow  = canvas->color565(210, 200, 180);  // Low-altitude horizon: warm gray
  uint16_t bottomHigh = canvas->color565(70, 90, 140);    // High-altitude horizon: blue-gray

  uint16_t topColor    = lerpColor(topLow, topHigh, altitudeRatio);
  uint16_t bottomColor = lerpColor(bottomLow, bottomHigh, altitudeRatio);

  for (int y = 0; y < 240; y++) {
    float t = (float)y / 240.0;
    canvas->drawFastHLine(0, y, 240, lerpColor(topColor, bottomColor, t));
  }
}

// Draw a single peak (with a snow line). greenFraction controls where the snow line sits; higher altitude = lower snow line
void drawSnowyPeak(int16_t apexX, int16_t apexY, int16_t baseLeftX, int16_t baseRightX,
                    int16_t baseY, uint16_t bodyColor, float greenFraction) {
  canvas->fillTriangle(apexX, apexY, baseLeftX, baseY, baseRightX, baseY, bodyColor);

  greenFraction = constrain(greenFraction, 0.05f, 0.85f);
  int16_t snowY      = apexY + (baseY - apexY) * greenFraction;
  int16_t snowLeftX  = apexX + (baseLeftX - apexX) * greenFraction;
  int16_t snowRightX = apexX + (baseRightX - apexX) * greenFraction;

  canvas->fillTriangle(apexX, apexY, snowLeftX, snowY, snowRightX, snowY, COLOR_CREAM_GREEN);
}

// Draw three peaks staggered at varying distances
void drawMountains(float altitudeRatio) {
  float greenRatio = 1.0f - altitudeRatio;  // Higher altitude = less vegetation area = lower snow line

  drawSnowyPeak(60,  110, -20, 140, 240, canvas->color565(60, 75, 65),  greenRatio * 0.7);
  drawSnowyPeak(200, 130, 150, 260, 240, canvas->color565(70, 85, 75),  greenRatio * 0.6);
  drawSnowyPeak(130, 70,  40,  220, 240, canvas->color565(45, 55, 50),  greenRatio);
}

// Draw an arc segment (the primitive used for the progress ring)
void drawRingArc(int16_t cx, int16_t cy, int16_t radius, int16_t thickness,
                  float startDeg, float endDeg, uint16_t color) {
  for (float deg = startDeg; deg <= endDeg; deg += 1.0) {
    float rad = deg * PI / 180.0;
    int16_t x0 = cx + cos(rad) * (radius - thickness / 2);
    int16_t y0 = cy + sin(rad) * (radius - thickness / 2);
    int16_t x1 = cx + cos(rad) * (radius + thickness / 2);
    int16_t y1 = cy + sin(rad) * (radius + thickness / 2);
    canvas->drawLine(x0, y0, x1, y1, color);
  }
}

// Draw the altitude progress ring along the screen edge, lighting up a gold arc segment in proportion to the altitude ratio
void drawProgressRing(float altitudeRatio) {
  int16_t cx = 120, cy = 120, radius = 115, thickness = 6;
  // First draw a full gray base ring
  drawRingArc(cx, cy, radius, thickness, -90, 269, canvas->color565(50, 50, 60));
  // Then overlay gold on the portion already climbed
  float endAngle = -90 + altitudeRatio * 359.0;
  drawRingArc(cx, cy, radius, thickness, -90, endAngle, canvas->color565(255, 200, 80));
}

// Draw text with a black outline/halo so white text doesn't blend into a light background and become unreadable
void drawTextWithHalo(int16_t x, int16_t y, const char *text, uint8_t textSize,
                       uint16_t textColor, uint16_t haloColor) {
  canvas->setTextSize(textSize);
  canvas->setTextColor(haloColor);
  // Offset 1 pixel in each direction to draw the outline
  canvas->setCursor(x - 1, y); canvas->print(text);
  canvas->setCursor(x + 1, y); canvas->print(text);
  canvas->setCursor(x, y - 1); canvas->print(text);
  canvas->setCursor(x, y + 1); canvas->print(text);

  canvas->setTextColor(textColor);
  canvas->setCursor(x, y);
  canvas->print(text);
}

// Draw centered text, automatically computing the offset from the text width
void drawCenteredText(int16_t centerX, int16_t y, const char *text, uint8_t textSize,
                       uint16_t textColor, uint16_t haloColor) {
  canvas->setTextSize(textSize);
  int16_t x1, y1;
  uint16_t w, h;
  canvas->getTextBounds(text, 0, 0, &x1, &y1, &w, &h);
  drawTextWithHalo(centerX - w / 2, y, text, textSize, textColor, haloColor);
}

// Draw all the data text overlay
void drawDataOverlay() {
  char buf[32];

  // Large text in the center of the screen: current altitude value
  sprintf(buf, "%d", (int)round(data.displayedAltitude));
  drawCenteredText(120, 68, buf, 4, COLOR_WHITE, COLOR_BLACK);
  drawCenteredText(120, 104, "m", 2, COLOR_WHITE, COLOR_BLACK);

  // Left side: orange up triangle + total ascent
  int16_t ascX = 58, ascY = 138;
  canvas->fillTriangle(ascX, ascY - 8, ascX - 7, ascY + 5, ascX + 7, ascY + 5,
                       canvas->color565(255, 140, 60));
  sprintf(buf, "%dm", (int)round(data.displayedAscent));
  drawTextWithHalo(ascX + 13, ascY - 7, buf, 2, COLOR_WHITE, COLOR_BLACK);

  // Right side: blue down triangle + total descent
  int16_t desX = 150, desY = 138;
  canvas->fillTriangle(desX, desY + 8, desX - 7, desY - 5, desX + 7, desY - 5,
                       canvas->color565(120, 180, 255));
  sprintf(buf, "%dm", (int)round(data.displayedDescent));
  drawTextWithHalo(desX + 13, desY - 7, buf, 2, COLOR_WHITE, COLOR_BLACK);

  // Small text at the bottom: live pressure
  sprintf(buf, "Press: %.1f hPa", data.displayedPressure);
  drawCenteredText(120, 162, buf, 1, COLOR_WHITE, COLOR_BLACK);
}

// Main render function: draw background -> mountains -> progress ring -> digits in order, then flush to the screen
void renderUI() {
  float altitudeRatio = constrain(data.displayedAltitude / ALT_RANGE_MAX, 0.0f, 1.0f);

  drawSkyBackground(altitudeRatio);
  drawMountains(altitudeRatio);
  drawProgressRing(altitudeRatio);
  drawDataOverlay();

  canvas->flush();  // Push the Canvas in-memory buffer to the physical screen in one shot
}

// Flash animation shown when calibration succeeds
void showCalibrationFlash() {
  for (int i = 0; i < 2; i++) {
    canvas->fillScreen(COLOR_WHITE);
    canvas->flush();
    delay(120);

    canvas->fillScreen(COLOR_BLACK);
    canvas->setTextColor(COLOR_WHITE);
    canvas->setTextSize(2);
    canvas->setCursor(48, 112);
    canvas->print("Calibrated!");
    canvas->flush();
    delay(120);
  }
  delay(300);
}


// ============================================================
//                       setup / loop
// ============================================================

void setup() {
  Serial.begin(115200);
  delay(1000);
  Serial.println("\n--- [System] Altitude logger starting ---");

  // Pull the backlight HIGH; without this step the screen stays black forever
  Serial.println("[TFT] Configuring backlight pin...");
  pinMode(TFT_BL, OUTPUT);
  digitalWrite(TFT_BL, HIGH);

  pinMode(BTN_PIN, INPUT_PULLUP);  // BOOT button internal pull-up

  // Initialize the display driver
  Serial.println("[TFT] Initializing Canvas...");
  if (!canvas->begin()) {
    Serial.println("[ERROR] Display driver initialization failed! Check the SPI pin configuration.");
  } else {
    Serial.println("[TFT] Display driver initialized successfully.");
  }

  COLOR_WHITE       = canvas->color565(255, 255, 255);
  COLOR_BLACK       = canvas->color565(0, 0, 0);
  COLOR_CREAM_GREEN = canvas->color565(205, 235, 195);  // Peak snow color (pale green-white)

  canvas->fillScreen(COLOR_BLACK);
  canvas->flush();

  // Initialize the sensor
  initSensor();

  // Read the first sample at boot to initialize all displayed values
  Serial.println("[Sensor] Reading initial boot data...");
  float rawAlt, rawPress;
  sampleSensor(rawAlt, rawPress);

  Serial.print("[Sensor] Boot reading -> pressure: ");
  Serial.print(rawPress);
  Serial.print(" hPa | altitude: ");
  Serial.print(rawAlt);
  Serial.println(" m");

  data.currentAltitude   = rawAlt;
  data.maxAltitude       = rawAlt;
  data.displayedAltitude = rawAlt;
  data.currentPressure   = rawPress;
  data.displayedPressure = rawPress;

  // Pre-fill the filter buffer with the boot altitude, preventing the value from jumping from 0 to the real altitude on startup
  for (int i = 0; i < FILTER_SIZE; i++) altBuffer[i] = rawAlt;
  filterCount = FILTER_SIZE;

  Serial.println("--- [System] Initialization complete, entering main loop ---");
}

// Sensor sampling timer (sample once per second)
unsigned long lastSampleTime = 0;
const unsigned long SAMPLE_INTERVAL = 1000;

// Screen rendering timer (~33 fps)
unsigned long lastRenderTime = 0;
const unsigned long RENDER_INTERVAL = 30;

void loop() {
  handleButton();

  unsigned long now = millis();

  // --- Low-frequency task: sample the sensor once per second ---
  if (now - lastSampleTime >= SAMPLE_INTERVAL) {
    lastSampleTime = now;

    float rawAltitude, rawPressure;
    sampleSensor(rawAltitude, rawPressure);

    float smoothed = smoothAltitude(rawAltitude);
    updateStats(smoothed);
    data.currentPressure = rawPressure;

    // Real-time serial log, useful for confirming the sensor is working while debugging
    Serial.print("[Loop] raw: ");      Serial.print(rawAltitude);
    Serial.print("m | filtered: ");    Serial.print(data.currentAltitude);
    Serial.print("m | pressure: ");    Serial.print(data.currentPressure);
    Serial.print(" hPa | ascent: ");   Serial.println(data.totalAscent);
  }

  // --- High-frequency task: render the UI at ~33fps ---
  if (now - lastRenderTime >= RENDER_INTERVAL) {
    lastRenderTime = now;

    // Exponential smoothing interpolation: makes the displayed digits smoothly track the actual value, the 0.12 coefficient controls tracking speed
    data.displayedAltitude += (data.currentAltitude  - data.displayedAltitude) * 0.12f;
    data.displayedAscent   += (data.totalAscent      - data.displayedAscent)   * 0.12f;
    data.displayedDescent  += (data.totalDescent     - data.displayedDescent)  * 0.12f;
    data.displayedPressure += (data.currentPressure  - data.displayedPressure) * 0.12f;

    renderUI();
  }

  delay(2);
}
Code walkthrough
The code is split into four modules that stay logically independent:
Module 1: Sensor reading — initSensor() initializes the I2C bus and checks whether the BMP180 is online; on failure it enters an infinite loop printing the error and never proceeds (handy for quickly pinning down the problem). sampleSensor() reads out the raw pressure (Pa to hPa) and altitude (relative to a standard sea level of 101325 Pa) each call.
Module 2: Data processing — smoothAltitude() applies a 5-point sliding average filter to reduce sensor noise; updateStats() accumulates ascent/descent with a 0.3 m dead zone so minor jitter on flat ground doesn’t inflate the totals.
Module 3: Button and calibration — handleButton() detects whether the BOOT button is held for more than 2000 ms, then triggers doCalibration() which zeroes ascent/descent and restarts statistics from the current altitude as the new baseline. The calibrationTriggered flag prevents multiple triggers during a single long press.
Module 4: UI rendering — uses Arduino_Canvas double buffering. Each frame first draws the gradient background, the peaks (with a dynamic snow line), the edge progress ring, and the digits all into memory, then canvas->flush() pushes everything to the screen in one shot, completely eliminating the flicker you’d get from line-by-line refresh. The digits are animated with exponential smoothing (coefficient 0.12) so changes feel natural rather than abrupt.
loop() uses dual timers to separate “low-frequency sampling (once per second)” from “high-frequency rendering (~33 fps)”, and neither blocks the other, keeping the overall responsiveness smooth.
Troubleshooting
Don’t panic — 90% of issues come down to the few things below:
Issue 1: The screen is completely black, not even the backlight is on
Check whether setup() actually executes digitalWrite(TFT_BL, HIGH) on GPIO 7. The backlight doesn’t turn on by itself — miss this line and the screen stays black forever. Also confirm VCC is connected to 3.3 V, not 5 V — 5 V will fry the display.
Issue 2: The backlight is on but the screen is all white or all black, no image
Open the Serial Monitor (115200 baud) and check for [ERROR] messages. If you see Display driver initialization failed, the SPI pins are wired wrong — go through the wiring table and verify all five lines: CS / DC / SCK / MOSI / RST.
Issue 3: The serial monitor keeps printing BMP180 initialization failed and the program hangs with a dark screen
A BMP180 init failure drops into an infinite loop, so the screen never lights up. 99% of the time it’s an I2C wiring issue: SDA to GPIO13, SCL to GPIO14, power from 3.3 V, and make sure the pull-up resistors on the module are soldered (reputable finished modules usually already have them).
Issue 4: It displays fine, but the altitude value is way off from reality
The BMP180 derives altitude relative to standard sea-level pressure (101325 Pa), and actual local pressure drifts with the weather, so an offset of ±30 m is normal. If you know your exact current altitude, you can swap the argument of bmp.readAltitude(101325) for your locally measured QNH sea-level pressure (in Pa — get it from a weather app and convert: hPa × 100 = Pa).
Issue 5: The total ascent keeps climbing even though I haven’t moved
Sensor noise has exceeded the dead zone (0.3 m). You can increase DEAD_ZONE in the code, e.g. to 0.8f or 1.0f, or bump FILTER_SIZE from 5 to 8 for more smoothing — either method cuts down the phantom gain.
Issue 6: The screen refresh flickers
With Canvas double buffering, it shouldn’t flicker in normal use. If it still does, check that canvas->flush() is called at the very end of renderUI(), and that nothing else is talking directly to gfx and bypassing the Canvas.
FAQ
Q: Can I swap the GC9A01 round display for a different square panel?
A: Yes. Arduino_GFX_Library supports dozens of display driver ICs (ST7789, ILI9341, etc.) — just replace the Arduino_GC9A01 line with the matching driver class name and change the Canvas size from 240×240 to your panel’s resolution; the UI code basically needs no changes.
Q: Can I replace the BMP180 with a BMP280 or BME280?
A: Yes, but you’ll need a different library. The BMP280 uses the Adafruit_BMP280 library and the BME280 uses Adafruit_BME280; the way you call readAltitude() differs slightly. The BMP280 is more accurate with standby current around 2.74 µA; the BME280 adds humidity sensing on top of that and costs a bit more.
Q: What’s the altitude accuracy of the BMP180, and is it normal for the numbers to keep jumping during indoor testing? A: The BMP180 is ±1 m in standard mode and down to ±0.5 m in high-resolution mode. Indoor readings jumping around is completely normal — opening a window, closing a door, or an AC draft all cause tiny pressure changes that affect the altitude reading. This project uses a 5-point sliding average plus a 0.3 m dead zone to suppress that jitter, and in practice the result is already pretty good.
Q: Can the ESP32-S3’s SPI (display) and I2C (sensor) be used at the same time? A: Absolutely. SPI and I2C are independent peripheral buses. In this project the GC9A01 runs over SPI (GPIO11/12) and the BMP180 runs over I2C (GPIO13/14), each on its own bus with no interference. The ESP32-S3 has no trouble driving both buses simultaneously.
Q: What is Arduino_Canvas in the code, and can I delete it and draw directly with gfx?
A: Arduino_Canvas is the double-buffered canvas provided by Arduino_GFX_Library — all drawing commands are first written into a virtual canvas in memory, and only pushed to the screen in one shot when flush() is called, eliminating the flicker of line-by-line refresh. Removing it and driving gfx directly will still run functionally, but a full-screen gradient background will flicker noticeably and the experience suffers a lot — not recommended.
Q: Can the ESP32-S3 run on a lithium battery and come hiking with me? A: Yes. A common setup is a 3.7 V lithium cell + a TP4056 charge/discharge module + an ME6211 LDO regulated down to 3.3 V. In this project’s configuration the combined current draw of the ESP32-S3 + GC9A01 + BMP180 is about 80–120 mA, so a 500 mAh cell theoretically runs 4–6 hours — enough for a day hike. For longer runtime, you can dim the backlight (PWM on GPIO7) or lengthen the sensor sampling interval.
Going further
Once you’ve finished this version, there’s more to tinker with:
- Add an SD card to log your track: write timestamp + altitude + pressure to a CSV file every 10 seconds, then import it into GPS track software back home for data analysis.
- Add a GPS module for fused positioning: the BMP180 drifts with the weather; GPS altitude accuracy is about ±10 m but more stable — fusing the two lets them cover each other’s weaknesses.
- Add an MPU6050 gyroscope/accelerometer for step counting: detect your stride rhythm to estimate step count and turn this into a full hiking data instrument.
- Push data to your phone over BLE: use the ESP32-S3’s BLE to stream real-time data to a phone app and display the full track on a map.