ESP32-S3 Air Quality Dashboard with GC9A01 Round Display + MQ135 (LVGL v9 + SPI + Arduino C++)
Build an animated air quality dashboard with ESP32-S3 + MQ135 gas sensor + GC9A01 1.28" round display + LVGL v9. Features dynamic arc gauge, real-time trend chart, and breathing glow effect. Complete wiring, code, and troubleshooting guide included.
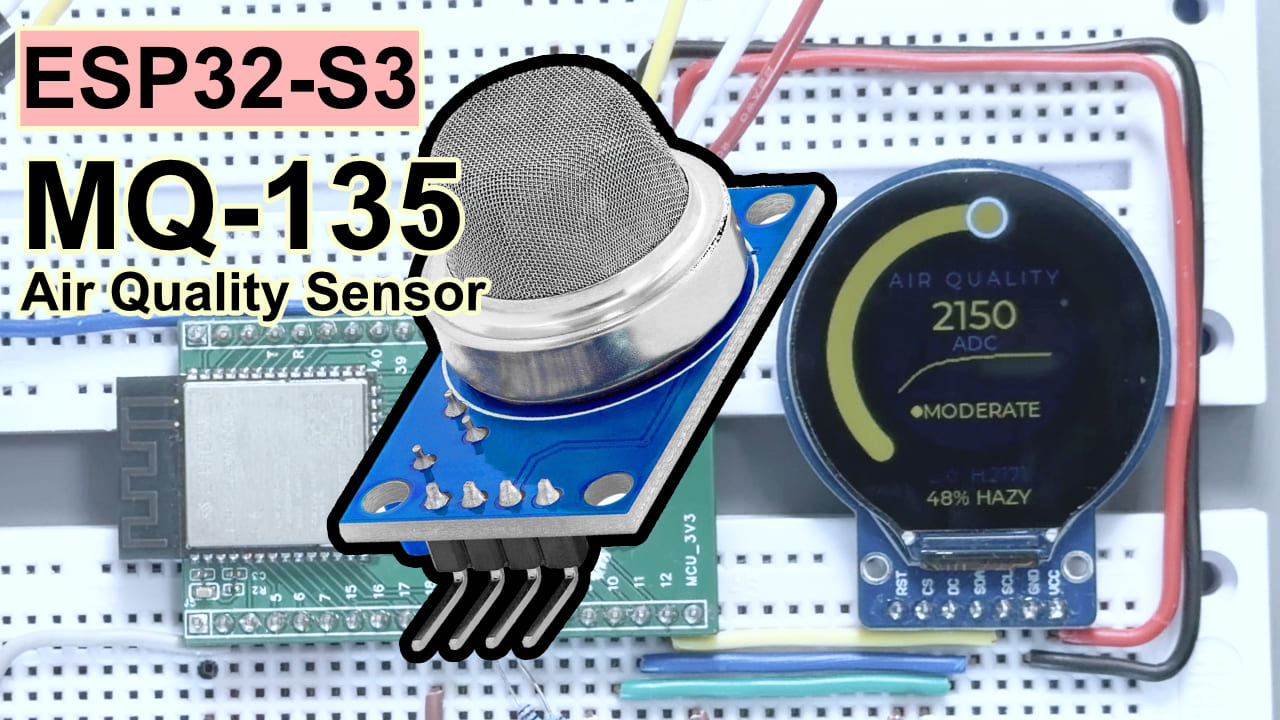
Difficulty: ⭐⭐☆☆☆ (Easy with just a few jumper wires) Time Required: 45 minutes Test Environment: Arduino IDE 2.3.8 · ESP32 Arduino Core 3.3.10 · lvgl v9.5.0 · Arduino_GFX_Library v1.6.5
TL;DR (Just want it running? Read this)
Expectation Management: This project is for learning, desktop decoration, and pure visual enjoyment. Do NOT use it for detecting actual hazardous gas leaks! Its accuracy is basically “pseudoscience.”
- Wiring: MQ135 A0 → GPIO 13; GC9A01 connect to GPIO 7 / 9 / 10 / 11 / 12 / 18 per table below
- Install Libraries: Search
lvgl(v9.x) +Arduino_GFX_Libraryin Arduino Library Manager- Configure lv_conf.h: Enable
LV_FONT_MONTSERRAT_14andLV_FONT_MONTSERRAT_28(change 0 → 1)- Upload → Round display lights up, gauge starts spinning
Introduction
Found another air quality sensor in my dusty collection—the MQ135 module. Thought I’d check the workshop air quality, so I hooked it up and tested it. The datasheet said this module needs 24 hours to warm up, which seemed like forever. However, this sensor is sensitive to multiple gases—not necessarily accurate, but when values rise, there’s something there: maybe CO₂, ammonia, benzene, alcohol, or smoke. For relative air quality judgment (like “should I open a window?”), it should work.
So this project was born: ESP32-S3 + MQ135 gas sensor + GC9A01 1.28“ round display + the famous LVGL v9 graphics library = air quality dashboard with animated arc gauge, real-time trend line, and color-changing “breathing” effects.
Article goal: From zero wiring to successful upload, fully reproduce this effect.
Experiment Result
The round display shows real-time air quality ADC value, status level (EXCELLENT / GOOD / FAIR / MODERATE / POOR / DANGER), and historical trend line. Gauge color gradients from green to red as air quality worsens, with a rhythmic “breathing” glow on the outer ring. The bottom-left corner records minimum and maximum values since power-on.
Component Overview
This article doesn’t cover the ESP32-S3 board—only the two modules beginners might not have worked with.
MQ135 Gas Sensor
MQ135 is a gas-sensitive sensor that detects concentration changes of CO₂, ammonia, benzene, and other harmful gases in air. In this project, it outputs 0~4095 analog ADC values reflecting current air quality level.
In plain English: It’s a chemical “nose”—the worse the air, the higher the output voltage, the larger the ADC value.
| Parameter | Value |
|---|---|
| Standard Operating Voltage | 5V (heater) / Analog output compatible with 3.3V |
| Output Interface | Analog (A0) + Digital (D0) |
| Warm-up Time | 24~48 hours (full accuracy) / ~3 minutes (trend reference) |
| Detectable Gases | CO₂, NH₃, NOₓ, benzene, alcohol, smoke |
About 3.3V Power: MQ135 standard voltage is 5V. At 3.3V, heater power is about 44% of standard, with reduced sensitivity and lower readings, but sufficient for trend display and relative change detection. For absolute accuracy, use separate 5V for VCC, with A0 analog output not exceeding 3.3V—no voltage divider needed to connect ESP32-S3.
Why I chose it: Cheap (under 5 yuan), modular, works with direct wiring—good enough for this “visual-first” project.
Proper Use of MQ135 for Indoor Air Quality
✅ Suitable for:
  - Air quality trend monitoring (relative values)
  - Threshold-triggered ventilation/alerts
  - Multiple harmful gas "composite pollution" indication

❌ NOT suitable for:
  - Precise single-gas concentration measurement
  - Medical/industrial-grade safety compliance
  - Accurate CO₂ values (error can exceed ±300ppm)
GC9A01 1.28“ Round TFT Display
GC9A01 is a 1.28“ round TFT LCD display that receives image data via SPI and renders it. In this project, it displays the animated gauge UI.
Analogy: Like the round watch face on a smartwatch that can display any content.
| Parameter | Value |
|---|---|
| Screen Size | 1.28 inches |
| Resolution | 240 × 240 pixels |
| Interface | SPI (up to 80 MHz) |
| Driver Chip | GC9A01 |
| Operating Voltage | 3.3V |
| Backlight Control | Supported (BL pin, PWM-dimmable) |
Why I chose it: Unique round shape, compact size, 3.3V-ready, Arduino_GFX_Library native support—perfect for LVGL gauge visuals.
BOM Table
| Component | Model / Spec | Quantity |
|---|---|---|
| Main Board | ESP32-S3 (with USB-C) | 1 |
| Round TFT Display | GC9A01 1.28“ 240×240 | 1 |
| Gas Sensor | MQ135 Module | 1 |
| Wiring | Jumper wires | Several |
Component Pin Description
MQ135 Module Pins
| Pin | Description |
|---|---|
| VCC | Power supply (connect to 3.3V in this project, standard is 5V) |
| GND | Ground |
| A0 | Analog signal output, connect to ESP32-S3 ADC pin |
| D0 | Digital output (not used in this project), outputs HIGH / LOW |
GC9A01 Module Pins
| Pin Label | Description |
|---|---|
| VCC | 3.3V power supply |
| GND | Ground |
| SCL / CLK | SPI clock |
| SDA / MOSI | SPI data |
| CS | Chip select (active low) |
| DC | Data/command switch |
| RST | Reset (active low) |
| BL | Backlight control (HIGH = on) (optional, not all modules expose this) |
Wiring Diagram
MQ135 → ESP32-S3
| MQ135 | ESP32-S3 |
|---|---|
| VCC | 5V |
| GND | GND |
| A0 | GPIO 13 |
GC9A01 → ESP32-S3
| GC9A01 Pin | ESP32-S3 GPIO |
|---|---|
| VCC | 3.3V |
| GND | GND |
| SCL / CLK | GPIO 12 |
| SDA / MOSI | GPIO 11 |
| CS | GPIO 9 |
| DC | GPIO 10 |
| RST | GPIO 18 |
| BL (backlight) | GPIO 7 (skip if not available) |
Practical Tip: After wiring, check line-by-line against the tables above—this saves 80% of troubleshooting time. The most common mix-up is DC and CS—swap these and the screen goes all white or all black, looking like “broken screen,” but it’s just wrong wiring.
Required Libraries
Open Arduino IDE → Tools → Manage Libraries, search and install these two:
| Library Name | Author | Tested Version |
|---|---|---|
lvgl |
LVGL | v9.5.0 |
Arduino_GFX_Library |
Moon On Our Nation | v1.6.5 |
After installing lvgl, one more required step:
- Find lvgl library directory (usually in
Documents/Arduino/libraries/lvgl/) - Copy
lv_conf_template.hand rename tolv_conf.h, place in the same directory aslvgl/ - Open
lv_conf.h, find these two lines, change0to1:#define LV_FONT_MONTSERRAT_14 1 #define LV_FONT_MONTSERRAT_28 1 - Open
lv_conf.h, find the very first#if 0and change to#if 1
Skip this step and upload directly, you’ll get
lv_font_montserrat_28 undeclaredcompile error. Don’t ask me how I know.
Complete Code
/*
 * ESP32-S3 + GC9A01 Round Air Quality Gauge v3.1
 * "Minimalist Tech Style" - Arc progress + Real-time trend + Breathing glow
 *
 * Test Environment: Arduino IDE 2.3.8 / ESP32 Core 3.3.10
 * Dependencies: lvgl v9.5.0 + Arduino_GFX_Library v1.6.5
 */

#include <Arduino.h>
#include <lvgl.h>
#include <Arduino_GFX_Library.h>
#include <math.h>

// ===================== Pin Definitions =====================
#define TFT_SCK    12   // SPI clock
#define TFT_MOSI   11   // SPI data
#define TFT_CS     9    // Chip select
#define TFT_DC     10   // Data/command switch (reversed = all-white screen)
#define TFT_RST    18   // Reset
#define TFT_BL     7    // Backlight—HIGH = on, forget this and screen stays black
#define MQ135_PIN  13   // MQ135 analog input (ADC2 channel, works fine without Wi-Fi)

#define SCREEN_WIDTH   240
#define SCREEN_HEIGHT  240

// ===================== Initialize Display Driver =====================
Arduino_ESP32SPI bus = Arduino_ESP32SPI(TFT_DC, TFT_CS, TFT_SCK, TFT_MOSI, -1);
Arduino_GC9A01 gfx = Arduino_GC9A01(&bus, TFT_RST, 0, true);

// ===================== LVGL Draw Buffer =====================
// 40-line buffer uses ~19KB on ESP32-S3, balanced speed and memory
#define DRAW_BUF_LINES 40
alignas(4) static uint16_t draw_buf[SCREEN_WIDTH * DRAW_BUF_LINES];

// ===================== Trend History Data =====================
#define TREND_POINTS 40    // Keep last 40 samples (× 300ms ≈ 12 seconds on screen)
static int trendData[TREND_POINTS] = {0};
static int trendIdx = 0;
static bool trendFull = false;
static lv_point_precise_t trendLinePoints[TREND_POINTS];

// ===================== LVGL UI Object Handles =====================
static lv_obj_t *arc_bg;          // Arc track background (dark)
static lv_obj_t *arc_main;        // Main arc + end knob dot
static lv_obj_t *glow_circle;     // Outer glow ring (breathing)
static lv_obj_t *center_circle;   // Center disc base
static lv_obj_t *label_value;     // Center large number (ADC value)
static lv_obj_t *label_unit;      // Unit label "ADC"
static lv_obj_t *label_status;    // Status text (EXCELLENT / GOOD...)
static lv_obj_t *dot_status;      // Status dot
static lv_obj_t *label_title;     // Top title "AIR QUALITY"
static lv_obj_t *label_score;     // Bottom cleanliness score
static lv_obj_t *label_minmax;    // Min/max values
static lv_obj_t *trend_line;      // Trend line
static lv_obj_t *trend_container; // Line clip container

// ===================== Sensor State =====================
static float smoothedValue = 0.0f; // Exponential weighted average
static bool firstSample = true;    // First frame flag, avoid animating from 0
static int minValue = 4095;        // Min ADC value this power cycle
static int maxValue = 0;           // Max ADC value this power cycle
static float displayValue = 0.0f; // UI animation interpolation

// ===================== LVGL Clock Callback =====================
static uint32_t my_tick_cb(void) { return millis(); }

// ===================== Flush Callback: LVGL renders region, push to screen =====================
void my_disp_flush(lv_display_t *disp, const lv_area_t *area, uint8_t *px_map) {
  uint32_t w = area->x2 - area->x1 + 1;
  uint32_t h = area->y2 - area->y1 + 1;
  gfx.draw16bitRGBBitmap(area->x1, area->y1, (uint16_t *)px_map, w, h);
  lv_display_flush_ready(disp); // Tell LVGL: this region done, continue next
}

// ===================== Color System: ADC value → Status color =====================
// Higher value = worse air = redder color, six levels = six states
uint32_t getColorHex(int v) {
  if (v < 600)  return 0x00E5A0; // EXCELLENT: fresh green
  if (v < 1200) return 0x22C55E; // GOOD: light green
  if (v < 2000) return 0xA3E635; // FAIR: yellow-green
  if (v < 2800) return 0xEAB308; // MODERATE: yellow
  if (v < 3500) return 0xF97316; // POOR: orange
  return 0xFF3355;                // DANGER: red (open a window)
}

lv_color_t getColor(int v) {
  return lv_color_hex(getColorHex(v));
}

// Arc track background (dark version of status color, matches dark background)
uint32_t getDimColorHex(int v) {
  if (v < 600)  return 0x0A2A20;
  if (v < 1200) return 0x0A2A15;
  if (v < 2000) return 0x1A2A10;
  if (v < 2800) return 0x2A2208;
  if (v < 3500) return 0x2A1808;
  return 0x2A0A10;
}

const char* getStatusText(int v) {
  if (v < 600)  return "EXCELLENT";
  if (v < 1200) return "GOOD";
  if (v < 2000) return "FAIR";
  if (v < 2800) return "MODERATE";
  if (v < 3500) return "POOR";
  return "DANGER";
}

// ADC value to cleanliness percentage (lower ADC = cleaner = higher score)
int adcToScore(int adc) {
  adc = constrain(adc, 0, 4095);
  return constrain(100 - (adc * 100 / 4095), 0, 100);
}

// ===================== Create UI Interface =====================
void create_ui() {
  lv_obj_t *scr = lv_screen_active();

  // Step 1: Dark background
  lv_obj_set_style_bg_opa(scr, LV_OPA_COVER, 0);
  lv_obj_set_style_bg_color(scr, lv_color_hex(0x050810), 0);

  // Step 2: Outermost glow ring (color follows state, breathing animation)
  glow_circle = lv_obj_create(scr);
  lv_obj_remove_style_all(glow_circle);
  lv_obj_set_size(glow_circle, 234, 234);
  lv_obj_center(glow_circle);
  lv_obj_set_style_radius(glow_circle, LV_RADIUS_CIRCLE, 0);
  lv_obj_set_style_bg_opa(glow_circle, LV_OPA_TRANSP, 0);
  lv_obj_set_style_border_width(glow_circle, 2, 0);
  lv_obj_set_style_border_opa(glow_circle, LV_OPA_20, 0);
  lv_obj_set_style_border_color(glow_circle, lv_color_hex(0x00E5A0), 0);
  lv_obj_set_style_shadow_width(glow_circle, 30, 0);
  lv_obj_set_style_shadow_spread(glow_circle, 2, 0);
  lv_obj_set_style_shadow_opa(glow_circle, LV_OPA_30, 0);
  lv_obj_set_style_shadow_color(glow_circle, lv_color_hex(0x00E5A0), 0);
  lv_obj_clear_flag(glow_circle, LV_OBJ_FLAG_SCROLLABLE);

  // Step 3: Arc track background (shows "not yet reached" dark area)
  arc_bg = lv_arc_create(scr);
  lv_obj_remove_style_all(arc_bg);
  lv_obj_set_size(arc_bg, 210, 210);
  lv_obj_center(arc_bg);
  lv_arc_set_range(arc_bg, 0, 100);
  lv_arc_set_bg_angles(arc_bg, 135, 45);
  lv_arc_set_value(arc_bg, 0);
  lv_obj_set_style_arc_width(arc_bg, 18, LV_PART_MAIN);
  lv_obj_set_style_arc_color(arc_bg, lv_color_hex(0x0A2A20), LV_PART_MAIN);
  lv_obj_set_style_arc_rounded(arc_bg, true, LV_PART_MAIN);
  lv_obj_set_style_arc_width(arc_bg, 0, LV_PART_INDICATOR);
  lv_obj_set_style_arc_opa(arc_bg, LV_OPA_TRANSP, LV_PART_INDICATOR);
  lv_obj_set_style_bg_opa(arc_bg, LV_OPA_TRANSP, LV_PART_KNOB);
  lv_obj_clear_flag(arc_bg, LV_OBJ_FLAG_CLICKABLE);

  // Step 4: Main arc (real-time value + end knob dot)
  arc_main = lv_arc_create(scr);
  lv_obj_remove_style_all(arc_main);
  lv_obj_set_size(arc_main, 210, 210);
  lv_obj_center(arc_main);
  lv_arc_set_range(arc_main, 0, 4095);
  lv_arc_set_bg_angles(arc_main, 135, 45);
  lv_arc_set_value(arc_main, 0);

  lv_obj_set_style_arc_width(arc_main, 18, LV_PART_MAIN);
  lv_obj_set_style_arc_opa(arc_main, LV_OPA_TRANSP, LV_PART_MAIN);

  lv_obj_set_style_arc_width(arc_main, 18, LV_PART_INDICATOR);
  lv_obj_set_style_arc_color(arc_main, lv_color_hex(0x00E5A0), LV_PART_INDICATOR);
  lv_obj_set_style_arc_rounded(arc_main, true, LV_PART_INDICATOR);

  // knob = end bright spot, white border + status color fill + glow shadow
  lv_obj_set_style_bg_color(arc_main, lv_color_hex(0x00E5A0), LV_PART_KNOB);
  lv_obj_set_style_bg_opa(arc_main, LV_OPA_COVER, LV_PART_KNOB);
  lv_obj_set_style_pad_all(arc_main, 5, LV_PART_KNOB);
  lv_obj_set_style_radius(arc_main, LV_RADIUS_CIRCLE, LV_PART_KNOB);
  lv_obj_set_style_border_width(arc_main, 3, LV_PART_KNOB);
  lv_obj_set_style_border_color(arc_main, lv_color_hex(0xFFFFFF), LV_PART_KNOB);
  lv_obj_set_style_border_opa(arc_main, LV_OPA_COVER, LV_PART_KNOB);
  lv_obj_set_style_shadow_width(arc_main, 18, LV_PART_KNOB);
  lv_obj_set_style_shadow_color(arc_main, lv_color_hex(0x00E5A0), LV_PART_KNOB);
  lv_obj_set_style_shadow_opa(arc_main, LV_OPA_70, LV_PART_KNOB);
  lv_obj_set_style_shadow_spread(arc_main, 2, LV_PART_KNOB);
  lv_obj_clear_flag(arc_main, LV_OBJ_FLAG_CLICKABLE);

  // Step 5: Center disc (holds value, trend line, status text)
  center_circle = lv_obj_create(scr);
  lv_obj_remove_style_all(center_circle);
  lv_obj_set_size(center_circle, 140, 140);
  lv_obj_center(center_circle);
  lv_obj_set_style_radius(center_circle, LV_RADIUS_CIRCLE, 0);
  lv_obj_set_style_bg_opa(center_circle, LV_OPA_COVER, 0);
  lv_obj_set_style_bg_color(center_circle, lv_color_hex(0x080E1A), 0);
  lv_obj_set_style_bg_grad_color(center_circle, lv_color_hex(0x0C1628), 0);
  lv_obj_set_style_bg_grad_dir(center_circle, LV_GRAD_DIR_VER, 0);
  lv_obj_set_style_border_width(center_circle, 1, 0);
  lv_obj_set_style_border_color(center_circle, lv_color_hex(0x1A3050), 0);
  lv_obj_set_style_border_opa(center_circle, LV_OPA_60, 0);
  lv_obj_set_style_pad_all(center_circle, 0, 0);
  lv_obj_clear_flag(center_circle, LV_OBJ_FLAG_SCROLLABLE);

  // Center large number
  label_value = lv_label_create(center_circle);
  lv_label_set_text(label_value, "0");
  lv_obj_set_style_text_font(label_value, &lv_font_montserrat_28, 0);
  lv_obj_set_style_text_color(label_value, lv_color_hex(0x00E5A0), 0);
  lv_obj_align(label_value, LV_ALIGN_CENTER, 0, -26);

  // Unit label
  label_unit = lv_label_create(center_circle);
  lv_label_set_text(label_unit, "ADC");
  lv_obj_set_style_text_font(label_unit, &lv_font_montserrat_14, 0);
  lv_obj_set_style_text_color(label_unit, lv_color_hex(0x506878), 0);
  lv_obj_align(label_unit, LV_ALIGN_CENTER, 0, -6);

  // Trend line container (handles clipping, prevents line overflow)
  trend_container = lv_obj_create(center_circle);
  lv_obj_remove_style_all(trend_container);
  lv_obj_set_size(trend_container, 110, 30);
  lv_obj_align(trend_container, LV_ALIGN_CENTER, 0, 16);
  lv_obj_set_style_bg_opa(trend_container, LV_OPA_TRANSP, 0);
  lv_obj_set_style_pad_all(trend_container, 0, 0);
  lv_obj_set_style_clip_corner(trend_container, true, 0);
  lv_obj_set_style_radius(trend_container, 4, 0);
  lv_obj_clear_flag(trend_container, LV_OBJ_FLAG_SCROLLABLE);

  // Trend line bottom reference baseline
  static lv_point_precise_t refPts[2] = {{0, 28}, {110, 28}};
  lv_obj_t *refLine = lv_line_create(trend_container);
  lv_line_set_points(refLine, refPts, 2);
  lv_obj_set_style_line_color(refLine, lv_color_hex(0x1A2535), 0);
  lv_obj_set_style_line_width(refLine, 1, 0);

  // Trend line (initialize all points to bottom)
  for (int i = 0; i < TREND_POINTS; i++) {
    trendLinePoints[i].x = (int32_t)(i * 110 / (TREND_POINTS - 1));
    trendLinePoints[i].y = 28;
  }
  trend_line = lv_line_create(trend_container);
  lv_line_set_points(trend_line, trendLinePoints, TREND_POINTS);
  lv_obj_set_style_line_color(trend_line, lv_color_hex(0x00E5A0), 0);
  lv_obj_set_style_line_width(trend_line, 2, 0);
  lv_obj_set_style_line_rounded(trend_line, true, 0);
  lv_obj_set_style_line_opa(trend_line, LV_OPA_70, 0);

  // Status dot
  dot_status = lv_obj_create(center_circle);
  lv_obj_remove_style_all(dot_status);
  lv_obj_set_size(dot_status, 8, 8);
  lv_obj_set_style_radius(dot_status, LV_RADIUS_CIRCLE, 0);
  lv_obj_set_style_bg_opa(dot_status, LV_OPA_COVER, 0);
  lv_obj_set_style_bg_color(dot_status, lv_color_hex(0x00E5A0), 0);
  lv_obj_set_style_shadow_width(dot_status, 8, 0);
  lv_obj_set_style_shadow_color(dot_status, lv_color_hex(0x00E5A0), 0);
  lv_obj_set_style_shadow_opa(dot_status, LV_OPA_50, 0);
  lv_obj_align(dot_status, LV_ALIGN_CENTER, -42, 42);

  // Status text
  label_status = lv_label_create(center_circle);
  lv_label_set_text(label_status, "EXCELLENT");
  lv_obj_set_style_text_font(label_status, &lv_font_montserrat_14, 0);
  lv_obj_set_style_text_color(label_status, lv_color_hex(0x00E5A0), 0);
  lv_obj_align(label_status, LV_ALIGN_CENTER, 3, 42);

  // Top title
  label_title = lv_label_create(scr);
  lv_label_set_text(label_title, "AIR QUALITY");
  lv_obj_set_style_text_font(label_title, &lv_font_montserrat_14, 0);
  lv_obj_set_style_text_color(label_title, lv_color_hex(0x4A6070), 0);
  lv_obj_set_style_text_letter_space(label_title, 3, 0);
  lv_obj_align(label_title, LV_ALIGN_TOP_MID, 0, 60);

  // Bottom score
  label_score = lv_label_create(scr);
  lv_label_set_text(label_score, "100% CLEAN");
  lv_obj_set_style_text_font(label_score, &lv_font_montserrat_14, 0);
  lv_obj_set_style_text_color(label_score, lv_color_hex(0x00E5A0), 0);
  lv_obj_align(label_score, LV_ALIGN_BOTTOM_MID, 0, -8);

  // MIN/MAX record (above bottom score)
  label_minmax = lv_label_create(scr);
  lv_label_set_text(label_minmax, "L:-- H:--");
  lv_obj_set_style_text_font(label_minmax, &lv_font_montserrat_14, 0);
  lv_obj_set_style_text_color(label_minmax, lv_color_hex(0x3A4A5A), 0);
  lv_obj_align(label_minmax, LV_ALIGN_BOTTOM_MID, 0, -24);
}

// ===================== Update Trend Line Data =====================
void updateTrend(int value) {
  trendData[trendIdx] = value;
  trendIdx = (trendIdx + 1) % TREND_POINTS;
  if (trendIdx == 0) trendFull = true;

  int count = trendFull ? TREND_POINTS : trendIdx;
  if (count < 2) return;

  // Find data range for normalizing to line height
  int vMin = 4095, vMax = 0;
  for (int i = 0; i < count; i++) {
    if (trendData[i] < vMin) vMin = trendData[i];
    if (trendData[i] > vMax) vMax = trendData[i];
  }
  // Ensure minimum fluctuation range—or line goes dead flat when too stable
  if (vMax - vMin < 50) vMax = vMin + 50;

  int chartW = 110;
  int chartH = 26;

  for (int i = 0; i < TREND_POINTS; i++) {
    int x = i * chartW / (TREND_POINTS - 1);
    int y;
    if (i < count) {
      int dataIdx = trendFull ? (trendIdx + i) % TREND_POINTS : i;
      int normalized = (trendData[dataIdx] - vMin) * chartH / (vMax - vMin);
      y = chartH - normalized + 1; // y-axis inverted: higher value = higher point
    } else {
      y = chartH + 1; // No data position goes to bottom
    }
    trendLinePoints[i].x = x;
    trendLinePoints[i].y = y;
  }

  lv_line_set_points(trend_line, trendLinePoints, TREND_POINTS);
}

// ===================== Update UI Display =====================
void update_ui(int value, int raw) {
  value = constrain(value, 0, 4095);
  raw   = constrain(raw, 0, 4095);

  // Smooth animation: approach target by 18% per frame, smooth not abrupt
  float diff = (float)value - displayValue;
  displayValue += diff * 0.18f;
  int dispVal = (int)(displayValue + 0.5f);

  lv_color_t c  = getColor(dispVal);
  uint32_t dimC = getDimColorHex(dispVal);
  int score     = adcToScore(dispVal);

  // Update min/max record
  if (raw < minValue) minValue = raw;
  if (raw > maxValue) maxValue = raw;

  // Main arc + knob color follows state
  lv_arc_set_value(arc_main, dispVal);
  lv_obj_set_style_arc_color(arc_main, c, LV_PART_INDICATOR);
  lv_obj_set_style_bg_color(arc_main, c, LV_PART_KNOB);
  lv_obj_set_style_shadow_color(arc_main, c, LV_PART_KNOB);

  // Track background color
  lv_obj_set_style_arc_color(arc_bg, lv_color_hex(dimC), LV_PART_MAIN);

  // Outer glow ring: color follows state + sin function simulates breathing opacity
  lv_obj_set_style_border_color(glow_circle, c, 0);
  lv_obj_set_style_shadow_color(glow_circle, c, 0);
  static uint32_t breathCount = 0;
  breathCount++;
  float sinVal = sinf((breathCount * 6) % 360 * 3.14159f / 180.0f);
  lv_opa_t breathOpa = (lv_opa_t)(LV_OPA_20 + (int)(sinVal * 25.0f));
  lv_obj_set_style_shadow_opa(glow_circle, breathOpa, 0);
  lv_opa_t borderOpa = (lv_opa_t)(LV_OPA_10 + (int)(sinVal * 15.0f));
  lv_obj_set_style_border_opa(glow_circle, borderOpa, 0);

  // Center value
  lv_label_set_text_fmt(label_value, "%d", dispVal);
  lv_obj_set_style_text_color(label_value, c, 0);

  // Status text + dot (dot shadow also breathes)
  lv_label_set_text(label_status, getStatusText(dispVal));
  lv_obj_set_style_text_color(label_status, c, 0);
  lv_obj_set_style_bg_color(dot_status, c, 0);
  lv_obj_set_style_shadow_color(dot_status, c, 0);
  lv_opa_t dotOpa = (lv_opa_t)(LV_OPA_30 + (int)(sinVal * 40.0f));
  lv_obj_set_style_shadow_opa(dot_status, dotOpa, 0);

  // Trend line color
  lv_obj_set_style_line_color(trend_line, c, 0);

  // MIN/MAX
  lv_label_set_text_fmt(label_minmax, "L:%d  H:%d", minValue, maxValue);

  // Bottom cleanliness score
  const char *statusWord;
  if (score >= 80)      statusWord = "CLEAN";
  else if (score >= 60) statusWord = "FAIR";
  else if (score >= 40) statusWord = "HAZY";
  else if (score >= 20) statusWord = "DIRTY";
  else                  statusWord = "TOXIC";
  lv_label_set_text_fmt(label_score, "%d%% %s", score, statusWord);
  lv_obj_set_style_text_color(label_score, c, 0);
}

// ===================== setup =====================
void setup() {
  Serial.begin(115200);
  delay(200);

  // Step 1: Pull backlight HIGH, skip this and screen stays black forever
  pinMode(TFT_BL, OUTPUT);
  digitalWrite(TFT_BL, HIGH);

  // Step 2: Configure ADC (12-bit precision, 0-3.3V range)
  // Note: ADC_11db in ESP32 Core 3.x equals ADC_ATTEN_DB_12, compatible with old syntax
  pinMode(MQ135_PIN, INPUT);
  analogReadResolution(12);
  analogSetAttenuation(ADC_11db);

  // Step 3: Start display, SPI frequency 40MHz
  gfx.begin(40000000);

  // Step 4: Initialize LVGL
  lv_init();
  lv_tick_set_cb(my_tick_cb);

  lv_display_t *disp = lv_display_create(SCREEN_WIDTH, SCREEN_HEIGHT);
  lv_display_set_color_format(disp, LV_COLOR_FORMAT_RGB565);
  lv_display_set_buffers(disp, draw_buf, NULL, sizeof(draw_buf), LV_DISPLAY_RENDER_MODE_PARTIAL);
  lv_display_set_flush_cb(disp, my_disp_flush);

  // Step 5: Build interface, initialize to 0 value
  create_ui();
  displayValue = 0;
  update_ui(0, 0);

  Serial.println("[SYS] Gauge v3.1 Ready!");
}

// ===================== loop =====================
void loop() {
  static uint32_t lastSensorMs = 0;
  static uint32_t lastTrendMs  = 0;
  static uint32_t lastLogMs    = 0;

  uint32_t now = millis();

  // Every 50ms: read sensor + refresh UI (~20fps, smooth no stutter)
  if (now - lastSensorMs >= 50) {
    int raw = analogRead(MQ135_PIN);
    raw = constrain(raw, 0, 4095);

    if (firstSample) {
      // First frame directly assign, skip animating from 0
      smoothedValue = raw;
      displayValue  = raw;
      firstSample   = false;
    } else {
      // Exponential weighted average: new value 12%, old value 88%, smooth but responsive
      smoothedValue = smoothedValue * 0.88f + raw * 0.12f;
    }

    update_ui((int)smoothedValue, raw);
    lastSensorMs = now;
  }

  // Every 300ms: push data point to trend line (40 points × 300ms ≈ 12 seconds per screen)
  if (now - lastTrendMs >= 300) {
    updateTrend((int)smoothedValue);
    lastTrendMs = now;
  }

  // Every 1s: serial output debug log (check issues with serial monitor)
  if (now - lastLogMs >= 1000) {
    Serial.printf("SCORE=%d%%  ADC=%d  SMOOTH=%d  L=%d H=%d [%s]\n",
                  adcToScore((int)smoothedValue),
                  analogRead(MQ135_PIN),
                  (int)smoothedValue,
                  minValue, maxValue,
                  getStatusText((int)smoothedValue));
    lastLogMs = now;
  }

  lv_timer_handler(); // LVGL internal task scheduling, must call periodically
  delay(5);
}
Code Explanation
A few key design notes, otherwise the code can be confusing:
① Why use exponential weighted average instead of raw ADC?
MQ135 analog output has noise—direct display makes numbers jump constantly. Exponential Weighted Average (EMA) formula:
New smoothed value = Old smoothed value × 0.88 + Raw value × 0.120.12 weight means new data has smaller impact, values change smoothly but still track trends. For faster response, increase 0.12f (max 1.0 = no smoothing); for more stability, increase 0.88f.
② How is the breathing effect implemented?
In update_ui(), use sinf() to generate a -1 to +1 cyclic value, mapped to opacity range (LV_OPA_20 ~ LV_OPA_45), increment counter each call. Outer ring border and shadow opacity fade in/out cyclically like “breathing.”
③ Why is the trend line sometimes flat?
When environment is very stable and historical data range is tiny, line is forced to at least 50 ADC fluctuation range:
if (vMax - vMin < 50) vMax = vMin + 50;This way, even with no air change, line won’t become dead flat and still shows微小 fluctuations.
Troubleshooting Guide
Don’t panic—80% of issues are here:
Screen completely black, no response
First thing: Check if BL pin is connected to GPIO 7, and if code executes digitalWrite(TFT_BL, HIGH). No backlight = black screen—this isn’t a broken screen, just backlight not pulled high.
Screen all white or all red (has color but no content) 90% chance DC and CS pins are reversed. Check wiring table for these two wires, or just swap them and test.
Compile error: lv_font_montserrat_28 undeclared
lv_conf.h not configured correctly, or in wrong location. Go back to “Required Libraries” section, follow steps to change font options from 0 to 1.
ADC reading always 0 or 4095 unchanged Use multimeter to measure MQ135 A0 pin output voltage, should fluctuate between 0.5V~2.5V. If 0V check VCC wiring; if full-scale (3.3V), sensor might not be warmed up—new sensor readings unstable when first powered, wait 3 minutes.
Value display jumps severely
Increase smoothing coefficient 0.88f in code (like 0.95f), more smoothing at cost of slower response.
LVGL compile says out of memory or runtime freeze
Reduce DRAW_BUF_LINES from 40 (like 20), reduce buffer usage. ESP32-S3 standard RAM is enough, only smaller RAM boards encounter this.
FAQ
Q: Is GPIO 13 fixed? Can I use other ADC pins?
A: Can change. ESP32-S3 GPIO 110 are ADC1, GPIO 1120 are ADC2. This project doesn’t use Wi-Fi, so ADC2 pins (including GPIO 13) have no conflict and work normally. If adding Wi-Fi later, move sensor to ADC1 pins (GPIO 1~10) to avoid Wi-Fi occupying ADC2 causing read errors.
Q: MQ135 at 3.3V power, how accurate is the reading? A: Not accurate enough, but sufficient for trend display. MQ135 rated voltage 5V, at 3.3V heater power is about 44% of standard, reduced sensitivity and lower absolute values. For ppm concentration conversion, use 5V for VCC separately, A0 analog output won’t exceed 3.3V, no extra voltage divider circuit needed.
Q: Must use LVGL v9? Can v8 run this?
A: v8 can’t directly run this code. v9 introduced lv_display_t, lv_display_create and other new APIs; v8 lacks these structures, direct compilation gives many errors. Strongly recommend v9.2.x or higher, don’t downgrade.
Q: Round screen has black “gaps” at corners, is soldering bad? A: Normal phenomenon, not an issue. GC9A01 has circular display area, underlying buffer is 240×240 square, corners are physical light-blocking structure, no actual pixels, not displaying content is correct.
Q: Sensor values jump a lot when first powered, how long to stabilize?
A: MQ135 needs warm-up. New sensors recommend continuous power 24~48 hours for stable readings; used sensors stabilize after ~3 minutes. Can add delay(180000) (3 minutes) at end of setup(), or add “warming up” status on UI, then start正式采集 after time.
Q: Screen refresh is laggy, how to speed up?
A: Two directions: ① Increase SPI frequency in gfx.begin(40000000) to 80MHz (GC9A01 max supports 80MHz, but some boards with poor wiring quality are unstable, test first); ② Increase DRAW_BUF_LINES (like 60), reduce LVGL partial refresh count, cost ~9KB more RAM.
Extensions
After running, continue in these directions:
- Add BME280 for temperature/humidity, gauge shows another line
- Report ADC data via Wi-Fi to Home Assistant for long-term historical curves
- Add button to switch display modes (gauge / large text / pure line)
- Change to MQ-7 sensor for carbon monoxide monitoring
- Add buzzer for alert when air quality enters DANGER zone