Drive a 4.2" E-Paper Display (SSD1683) with ESP32-S3 | Build an AQICN Air Quality Dashboard (GxEPD2 + SPI)
Use an ESP32-S3 and GxEPD2 to drive a 4.2-inch black-and-white e-paper panel (GDEY042A87 / SSD1683) and pull data from the AQICN air-quality API to build a desktop dashboard that keeps its image even when powered off. Includes wiring, complete Arduino C++ code, partition-scheme setup, and a full troubleshooting guide.
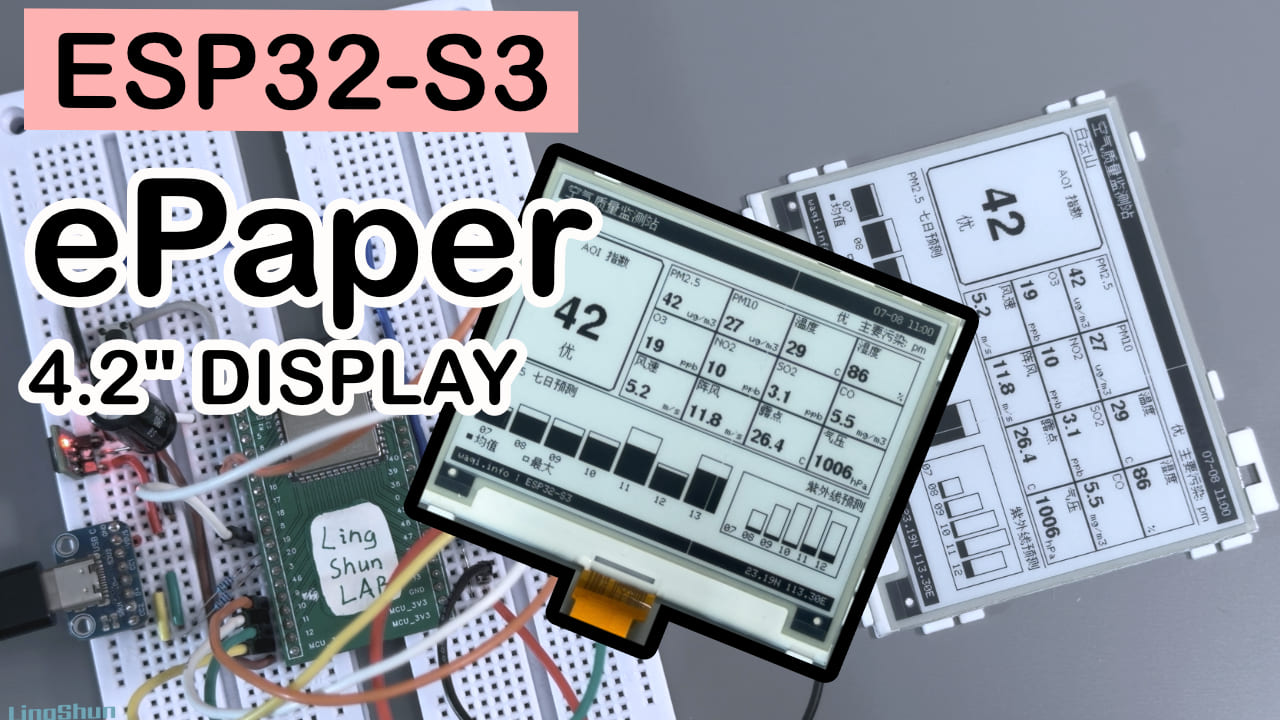
One-line summary: Grab a secondhand 4.2“ black-and-white e-paper panel for a few bucks, pair it with an ESP32-S3, and hook it up to the AQICN air-quality API to build a desktop air-quality dashboard — no phone needed, just a glance to tell whether today’s a go for hiking Baiyun Mountain.
Difficulty: ⭐⭐☆☆☆ (beginner-friendly) Estimated time: 30 minutes Tested with: Arduino IDE 2.3.8 + ESP32 Arduino Core 3.3.10 + GxEPD2 v1.6.9 + Adafruit GFX Library v1.12.6 + ArduinoJson v7.4.3 (try to match these versions when installing the libraries — going too new or too old is a reliable way to step into a pitfall.)
TL;DR (quick start):
- Wiring: GPIO11 → SDI/MOSI, GPIO12 → SCL/SCK, GPIO10 → CS, GPIO9 → DC, GPIO8 → RES, GPIO7 → BUSY, VCC to 3.3V, GND to common ground.
- Install libraries: ArduinoJson, GxEPD2, Adafruit GFX Library, U8g2_for_Adafruit_GFX (by olikraus).
- Replace
WIFI_SSID,WIFI_PASS, andAPI_TOKENin the code with your own (see the “Get a Free AQICN API Token” section below for how to apply for a Token).- Flash the sketch, wait for WiFi to connect, and the panel will auto-refresh with the air-quality data.
Introduction
I picked up a black-and-white e-paper panel at a secondhand market for next to nothing. Honestly, I was a little nervous when I placed the order — if it turned out to be a dud, the money was just gone. Power-on test showed everything normal, no disaster — though one vertical line is dead, it doesn’t affect much. While the panel was still warm, I figured I’d build a little dashboard that always displays, needs no phone app, and tells me at a glance whether the air around Baiyun Mountain is good enough to go hike. This article records the full wiring, code, and gotchas I hit along the way — follow along and it should light up on your first try.
The Result
An ESP32-S3 pulls air-quality data from AQICN.ORG on a timer and refreshes it onto the e-paper panel. The screen shows a big AQI number, 12 detailed metrics (PM2.5, PM10, temperature/humidity, wind speed, etc.), plus a 7-day forecast bar chart for PM2.5 and UV. The image survives power-off, and sitting on the desk it’s basically a “desktop weather oracle” — a great little desk setup.
Component Overview
ESP32-S3 dev board is a WiFi-equipped SoC dev board that handles networking, runs the logic, and pushes the frame to the panel over SPI — the brain of the whole project. I picked it because it has plenty of GPIO, enough horsepower, and built-in WiFi, so there’s no need for an extra network module.
E-paper driver board (homemade) translates the SPI commands coming from the ESP32 into the voltage levels the panel understands — essentially a “translator.” I designed my own board because it’s fun. The pinout it exposes matches what’s on the market, so if you have another e-paper driver board, give that a try too.
4.2“ black-and-white e-paper panel is a display that uses an electric field to flip black-and-white particles inside microcapsules. Its signature trick is holding the image even with no power, which makes it perfect for “glance and go” info dashboards. It’s nowhere near as power-hungry as an LCD — the only trade-off is a slow refresh, so it’s not built for animation.
BOM
| Component | Model / Spec | Qty |
|---|---|---|
| ESP32 dev board | ESP32-S3 (any model with enough SPI pins works) | 1 |
| E-paper driver board | Homemade PCB, pinout matches mainstream e-paper driver boards | 1 |
| E-paper panel | 4.2“ black-and-white, compatible with the GxEPD2_420_GYE042A87 driver | 1 |
| Dupont wires | a handful |
Pinout
| Pin | Full name | Purpose |
|---|---|---|
| VCC | Power positive | Power input — connect to the ESP32-S3’s 3V3 output |
| GND | Ground | Reference ground — connect to the ESP32-S3’s GND to complete the circuit |
| SDI/MOSI | Master Out, Slave In | SPI data line — ESP32 sends data to the panel |
| SCL/SCK | Serial Clock | SPI clock line — paces the data transfer |
| CS | Chip Select | Tells the panel “the next bytes are for you” |
| DC | Data/Command select | Distinguishes between pixel data and control commands |
| RES/RST | Reset | Pull low for a moment to re-initialize the panel |
| BUSY | Busy status indicator | Pulled low while the panel is refreshing — the ESP32 reads it to decide “can I send the next command yet?” |
Wiring
| E-paper pin | ESP32-S3 pin |
|---|---|
| SDI/MOSI | GPIO11 |
| SCL/SCK | GPIO12 |
| CS | GPIO10 |
| DC | GPIO9 |
| RES | GPIO8 |
| BUSY | GPIO7 |
| VCC | 3.3V |
| GND | GND |
After wiring, double-check each line one by one — it saves about 80% of your troubleshooting time. The sneakiest thing about e-paper is that miswired lines don’t throw errors; the panel just sits there garbled or blank, and it’s hard to tell at a glance whether the culprit is your code or your jumper wires.
Libraries to Install
Open the Arduino IDE Library Manager and install the following (the tested versions are for reference — the latest stable version in the Library Manager is generally fine):
| Library | Purpose | Tested version |
|---|---|---|
| ArduinoJson | Parses the JSON returned by the AQICN API | v7.4.3 |
| GxEPD2 | Core e-paper driver library | v1.6.9 |
| Adafruit GFX Library | Base graphics library that GxEPD2 depends on | v1.12.6 |
| U8g2_for_Adafruit_GFX | Bridges U8g2’s Chinese font tables into Adafruit GFX for displaying Chinese | v1.8.0 (by olikraus) |
WiFi.h, HTTPClient.h, and SPI.h ship with the ESP32 core — no separate install needed. As long as the ESP32 board support package is installed, you already have them.
Flashing Config: Partition Scheme (Important)
There’s one gotcha to nail down first: this project uses the full Chinese font tables from U8g2_for_Adafruit_GFX (the code references three sets: u8g2_font_wqy16_t_gb2312, wqy14, and wqy12), and these GB2312 fonts add up to nearly 500KB. The ESP32’s default partition scheme only leaves 1MB for the program region, so compilation throws “out of space (region `app’ overflowed)” and the flash fails outright.
The fix: bump the partition scheme up before uploading.
Path: Arduino IDE top menu → Tools → Partition Scheme → pick Huge APP (3MB No OTA/1MB SPIFFS).
That’s the one I use — Huge APP gives the program region a roomy 3MB in one go, and both the fonts and the code fit comfortably. Compile and flash go smoothly.
💡 A few extra notes:
- Why is the font table so big? GB2312 packs six to seven thousand Chinese characters, and every wqy font set is a couple hundred KB of bitmap data — there’s no shrinking them the way Latin font tables shrink.
- The cost of No OTA: Picking No OTA means you can’t do over-the-air firmware updates — you’re stuck flashing over USB. For a desktop trinket that’s no loss at all, since it sits on the desk plugged in anyway.
- A better option on large-Flash boards: If your ESP32-S3 has ≥8MB of Flash, you can pick a more generous scheme (e.g.
8M with SPIFFS), which keeps OTA alive and gives you extra room for data.- After changing the partition scheme, remember to recompile — don’t just hit “Upload” with the old config.
Get a Free AQICN API Token
The API_TOKEN and station ID (like @14370) in the code both come from AQICN (aqicn.org). It’s free to apply for — four steps and you’re there.
Step 1: Find your city
Open aqicn.org, type the city or monitoring station you want to track into the search box in the top right (e.g. “Guangzhou” or “Baiyun Mountain”), and click into the matching air-quality page.
Step 2: Head to the API data platform
On that city page, scroll down and find the link labeled “json: api” — click it and you’ll jump to the AQICN data platform.
Step 3: Register and activate your account
Register with your email, then click the activation link in your inbox to verify. Once you log in, the dashboard shows your personal Token (a random string — keep it secret, and don’t paste it straight into a public repo).
Step 4: Assemble the API URL and drop it into the code
Paste the Token into the API_TOKEN macro in the code, then swap the @14370 in API_URL for the station ID you want (you can also use a city’s English name or lat/long coordinates — see the AQICN API docs for the exact syntax). The full format:
https://api.waqi.info/feed/@14370/?token=你的TokenTo confirm the URL is good, paste that string straight into your browser’s address bar — if you see JSON come back with "status":"ok", you’re connected.
AQICN personal Tokens are completely free, no card required, and the quota is generous enough for any personal project — no need to worry about charges.
Full Code + Walkthrough
/*
 * ============================================================
 * ESP32-S3 + 4.2" 墨水屏 空气质量监测站  (v2.1 横屏优化版)
 * Air Quality Monitor using AQICN API
 * ============================================================
 *
 * 本版本相对上一版做了如下修改:
 * 1. 彻底删除了底部显示不全的 PM10 预测表格及其标题。
 * 2. 将上方的 AQI 方块和 12项指标网格高度从 128 扩大至 141,行高更宽松。
 * 3. 将 PM2.5 和紫外线预测图表的高度从 52 扩大至 64,画面更舒展。
 * 4. 重新计算了所有垂直坐标,底部保留少许清爽留白。
 *
 * 硬件连接 (不变):
 * EPD_CS   -> GPIO 10
 * EPD_DC   -> GPIO 9
 * EPD_RST  -> GPIO 8
 * EPD_BUSY -> GPIO 7
 * EPD_MOSI -> GPIO 11
 * EPD_CLK  -> GPIO 12
 * ============================================================
 */

#include <WiFi.h>
#include <HTTPClient.h>
#include <ArduinoJson.h>
#include <SPI.h>
#include <GxEPD2_BW.h>
#include <Adafruit_GFX.h>
#include <U8g2_for_Adafruit_GFX.h>

// 粗体数字字体 (Adafruit GFX 自带)
#include <Fonts/FreeSansBold9pt7b.h>
#include <Fonts/FreeSansBold12pt7b.h>
#include <Fonts/FreeSansBold24pt7b.h>

// ==================== 配置区 ====================
#define WIFI_SSID     "YOUR_WIFI_SSID"
#define WIFI_PASS     "YOUR_WIFI_PASSWORD"
#define API_TOKEN     "YOUR_WIFI_AQI_API_TONKEN"
#define API_URL       "https://api.waqi.info/feed/@14370/?token=" API_TOKEN

#define UPDATE_INTERVAL_MS  (30 * 60 * 1000)  // 30分钟更新一次

// 如果画面上下颠倒,把这里改成 1
#define ROTATION_FLIP 0

// ==================== 引脚定义 ====================
#define EPD_CS   10
#define EPD_DC   9
#define EPD_RST  8
#define EPD_BUSY 7
#define EPD_MOSI 11
#define EPD_CLK  12

// ==================== 墨水屏驱动 ====================
GxEPD2_BW<GxEPD2_420_GYE042A87, GxEPD2_420_GYE042A87::HEIGHT> display(
  GxEPD2_420_GYE042A87(EPD_CS, EPD_DC, EPD_RST, EPD_BUSY)
);

// U8g2 中文渲染桥接对象
U8G2_FOR_ADAFRUIT_GFX u8f;

// ==================== 数据结构 ====================
struct ForecastDay {
  char day[6];   // "07-08"
  int avg;
  int maxVal;
  int minVal;
};

struct AqiData {
  int aqi;
  char city[32];
  char timeStr[20];
  char timeShort[12];   // 精简时间 "07-08 14:00"
  char dominentpol[8];
  float lat, lon;

  float co, dew, h, no2, o3, p, pm10, pm25, so2, t, w, wg;

  ForecastDay pm25Forecast[8];
  int pm25ForecastCount;
  ForecastDay pm10Forecast[8];
  int pm10ForecastCount;
  ForecastDay uviForecast[8];
  int uviForecastCount;
};

AqiData aqiData;

// ==================== 辅助函数: AQI 等级 ====================
const char* getAqiLevel(int aqi) {
  if (aqi <= 50)  return "Good";
  if (aqi <= 100) return "Moderate";
  if (aqi <= 150) return "Unhealthy-S";
  if (aqi <= 200) return "Unhealthy";
  if (aqi <= 300) return "V.Unhealthy";
  return "Hazardous";
}

const char* getAqiLevelCN(int aqi) {
  if (aqi <= 50)  return "优";
  if (aqi <= 100) return "良";
  if (aqi <= 150) return "轻度污染";
  if (aqi <= 200) return "中度污染";
  if (aqi <= 300) return "重度污染";
  return "严重污染";
}

// ==================== WiFi 连接 ====================
void connectWiFi() {
  Serial.printf("Connecting to WiFi: %s", WIFI_SSID);
  WiFi.begin(WIFI_SSID, WIFI_PASS);
  int retries = 0;
  while (WiFi.status() != WL_CONNECTED && retries < 40) {
    delay(500);
    Serial.print(".");
    retries++;
  }
  if (WiFi.status() == WL_CONNECTED) {
    Serial.printf("\nConnected! IP: %s\n", WiFi.localIP().toString().c_str());
  } else {
    Serial.println("\nWiFi connection FAILED!");
  }
}

// ==================== 解析预报数组 ====================
int parseForecastArray(JsonArray arr, ForecastDay* out, int maxCount) {
  int count = 0;
  for (JsonObject item : arr) {
    if (count >= maxCount) break;
    const char* dayStr = item["day"];
    if (dayStr && strlen(dayStr) >= 10) {
      strncpy(out[count].day, dayStr + 5, 5);
      out[count].day[5] = '\0';
    }
    out[count].avg    = item["avg"] | 0;
    out[count].maxVal = item["max"] | 0;
    out[count].minVal = item["min"] | 0;
    count++;
  }
  return count;
}

// ==================== API 请求与解析 ====================
bool fetchAqiData() {
  if (WiFi.status() != WL_CONNECTED) {
    Serial.println("WiFi not connected, skipping fetch.");
    return false;
  }

  HTTPClient http;
  http.begin(API_URL);
  http.setTimeout(15000);
  int httpCode = http.GET();

  if (httpCode != 200) {
    Serial.printf("HTTP GET failed, code: %d\n", httpCode);
    http.end();
    return false;
  }

  String payload = http.getString();
  http.end();

  JsonDocument doc;
  DeserializationError err = deserializeJson(doc, payload);
  if (err) {
    Serial.printf("JSON parse error: %s\n", err.c_str());
    return false;
  }

  const char* status = doc["status"];
  if (!status || strcmp(status, "ok") != 0) {
    Serial.println("API status not OK");
    return false;
  }

  JsonObject data = doc["data"];
  aqiData.aqi = data["aqi"] | 0;

  const char* cityName = data["city"]["name"];
  if (cityName) {
    const char* comma = strchr(cityName, ',');
    if (comma) {
      int len = comma - cityName;
      if (len > 31) len = 31;
      strncpy(aqiData.city, cityName, len);
      aqiData.city[len] = '\0';
    } else {
      strncpy(aqiData.city, cityName, 31);
      aqiData.city[31] = '\0';
    }
  }

  const char* timeS = data["time"]["s"];
  if (timeS) {
    strncpy(aqiData.timeStr, timeS, 19);
    aqiData.timeStr[19] = '\0';
    if (strlen(timeS) >= 16) {
      memcpy(aqiData.timeShort, timeS + 5, 11);
      aqiData.timeShort[11] = '\0';
    } else {
      aqiData.timeShort[0] = '\0';
    }
  }

  const char* dpol = data["dominentpol"];
  if (dpol) {
    strncpy(aqiData.dominentpol, dpol, 7);
    aqiData.dominentpol[7] = '\0';
  }

  aqiData.lat = data["city"]["geo"][0] | 0.0f;
  aqiData.lon = data["city"]["geo"][1] | 0.0f;

  JsonObject iaqi = data["iaqi"];
  aqiData.co   = iaqi["co"]["v"]   | 0.0f;
  aqiData.dew  = iaqi["dew"]["v"]  | 0.0f;
  aqiData.h    = iaqi["h"]["v"]    | 0.0f;
  aqiData.no2  = iaqi["no2"]["v"]  | 0.0f;
  aqiData.o3   = iaqi["o3"]["v"]   | 0.0f;
  aqiData.p    = iaqi["p"]["v"]    | 0.0f;
  aqiData.pm10 = iaqi["pm10"]["v"] | 0.0f;
  aqiData.pm25 = iaqi["pm25"]["v"] | 0.0f;
  aqiData.so2  = iaqi["so2"]["v"]  | 0.0f;
  aqiData.t    = iaqi["t"]["v"]    | 0.0f;
  aqiData.w    = iaqi["w"]["v"]    | 0.0f;
  aqiData.wg   = iaqi["wg"]["v"]   | 0.0f;

  JsonObject forecast = data["forecast"]["daily"];
  aqiData.pm25ForecastCount = parseForecastArray(
    forecast["pm25"].as<JsonArray>(), aqiData.pm25Forecast, 8);
  aqiData.pm10ForecastCount = parseForecastArray(
    forecast["pm10"].as<JsonArray>(), aqiData.pm10Forecast, 8);
  aqiData.uviForecastCount = parseForecastArray(
    forecast["uvi"].as<JsonArray>(), aqiData.uviForecast, 8);

  Serial.printf("Data parsed OK! AQI=%d, City=%s\n", aqiData.aqi, aqiData.city);
  return true;
}

// ==================== 绘图小工具 ====================
void drawCN(int x, int y, const char* utf8, bool whiteOnBlack, const uint8_t* font) {
  u8f.setFont(font);
  if (whiteOnBlack) {
    u8f.setForegroundColor(GxEPD_WHITE);
    u8f.setBackgroundColor(GxEPD_BLACK);
  } else {
    u8f.setForegroundColor(GxEPD_BLACK);
    u8f.setBackgroundColor(GxEPD_WHITE);
  }
  int baselineY = y + u8f.getFontAscent();
  u8f.setCursor(x, baselineY);
  u8f.print(utf8);
}

void drawCNCentered(int cx, int y, const char* utf8, bool whiteOnBlack, const uint8_t* font) {
  u8f.setFont(font);
  uint16_t w = u8f.getUTF8Width(utf8);
  drawCN(cx - w / 2, y, utf8, whiteOnBlack, font);
}

void drawCNRight(int rightX, int y, const char* utf8, bool whiteOnBlack, const uint8_t* font) {
  u8f.setFont(font);
  uint16_t w = u8f.getUTF8Width(utf8);
  drawCN(rightX - w, y, utf8, whiteOnBlack, font);
}

void drawBold(const GFXfont* font, const char* text, int x, int baselineY) {
  display.setFont(font);
  display.setTextColor(GxEPD_BLACK);
  display.setCursor(x, baselineY);
  display.print(text);
  display.setFont(NULL);
}

void drawBoldCentered(const GFXfont* font, const char* text, int cx, int baselineY) {
  display.setFont(font);
  int16_t x1, y1; uint16_t w, h;
  display.getTextBounds(text, 0, 0, &x1, &y1, &w, &h);
  display.setFont(NULL);
  drawBold(font, text, cx - w / 2 - x1, baselineY);
}

// ==================== 绘制 UI (横屏 400x300优化版) ====================
void drawUI() {
  int W = display.width();
  int H = display.height();

  display.firstPage();
  do {
    display.fillScreen(GxEPD_WHITE);

    // ---------- 顶部标题栏 (0-20) ----------
    display.fillRect(0, 0, W, 20, GxEPD_BLACK);
    drawCN(6, 6, "空气质量监测站", true, u8g2_font_wqy14_t_gb2312);
    drawCNRight(W - 6, 5, aqiData.timeShort, true, u8g2_font_wqy12_t_gb2312);

    // ---------- 位置行 (20-34) ----------
    drawCN(6, 24, aqiData.city, false, u8g2_font_wqy14_t_gb2312);
    char levelLine[24];
    snprintf(levelLine, sizeof(levelLine), "%s · 主要污染: %s", getAqiLevelCN(aqiData.aqi), aqiData.dominentpol);
    drawCNRight(W - 6, 24, levelLine, false, u8g2_font_wqy12_t_gb2312);

    display.drawFastHLine(4, 36, W - 8, GxEPD_BLACK);

    // ---------- AQI 大方块 (左, 40-181) [高度增加到141] ----------
    int aqiBoxX = 6, aqiBoxY = 40, aqiBoxW = 118, aqiBoxH = 141;
    display.drawRoundRect(aqiBoxX, aqiBoxY, aqiBoxW, aqiBoxH, 6, GxEPD_BLACK);
    display.drawRoundRect(aqiBoxX + 1, aqiBoxY + 1, aqiBoxW - 2, aqiBoxH - 2, 5, GxEPD_BLACK);

    drawCNCentered(aqiBoxX + aqiBoxW / 2, aqiBoxY + 12, "AQI 指数", false, u8g2_font_wqy12_t_gb2312);

    char aqiStr[8];
    snprintf(aqiStr, sizeof(aqiStr), "%d", aqiData.aqi);
    drawBoldCentered(&FreeSansBold24pt7b, aqiStr, aqiBoxX + aqiBoxW / 2, aqiBoxY + 98);

    drawCNCentered(aqiBoxX + aqiBoxW / 2, aqiBoxY + 114, getAqiLevelCN(aqiData.aqi), false, u8g2_font_wqy16_t_gb2312);

    // ---------- 指标网格 (右, 40-181) [高度增加到141] ----------
    int gridX = 130, gridY = 40, gridW = 264, gridH = 141;
    int cols = 4, rows = 3;
    int cellW = gridW / cols;   // 66
    int cellH = gridH / rows;   // 47 (刚好整除)

    struct Metric {
      const char* label;
      float value;
      const char* unit;
      int decimals;
    };
    Metric metrics[] = {
      {"PM2.5", aqiData.pm25, "ug/m3", 0},
      {"PM10",  aqiData.pm10, "ug/m3", 0},
      {"温度",  aqiData.t,    "C",     0},
      {"湿度",  aqiData.h,    "%",     0},
      {"O3",    aqiData.o3,   "ppb",   0},
      {"NO2",   aqiData.no2,  "ppb",   0},
      {"SO2",   aqiData.so2,  "ppb",   1},
      {"CO",    aqiData.co,   "mg/m3", 1},
      {"风速",  aqiData.w,    "m/s",   1},
      {"阵风",  aqiData.wg,   "m/s",   1},
      {"露点",  aqiData.dew,  "C",     1},
      {"气压",  aqiData.p,    "hPa",   0},
    };

    for (int i = 0; i < 12; i++) {
      int col = i % cols;
      int row = i / cols;
      int x = gridX + col * cellW;
      int y = gridY + row * cellH;
      int h = cellH;

      display.drawRect(x, y, cellW, h, GxEPD_BLACK);

      // 标签 (稍微靠下一两像素,居中感更好)
      drawCN(x + 3, y + 4, metrics[i].label, false, u8g2_font_wqy12_t_gb2312);

      // 数值 (粗体)
      char valStr[12];
      if (metrics[i].decimals == 0)
        snprintf(valStr, sizeof(valStr), "%.0f", metrics[i].value);
      else
        snprintf(valStr, sizeof(valStr), "%.1f", metrics[i].value);
      drawBold(&FreeSansBold9pt7b, valStr, x + 3, y + h - 8);

      // 单位
      display.setFont(NULL);
      display.setTextSize(1);
      int16_t tx, ty; uint16_t tw, th;
      display.getTextBounds(metrics[i].unit, 0, 0, &tx, &ty, &tw, &th);
      display.setCursor(x + cellW - tw - 3, y + h - 11);
      display.print(metrics[i].unit);
    }

    // 中间分割线
    display.drawFastHLine(4, 183, W - 8, GxEPD_BLACK);

    // ---------- 预报区 (190-282) [高度由52增加至64,排版更宽松] ----------
    drawCN(6, 190, "PM2.5 七日预测", false, u8g2_font_wqy12_t_gb2312);
    drawCNRight(W - 6, 190, "紫外线预测", false, u8g2_font_wqy12_t_gb2312);

    int barStartX = 6;
    int barStartY = 204;
    int barAreaW  = 258;
    int barAreaH  = 64;
    int barCount  = min(aqiData.pm25ForecastCount, 7);
    int barGap    = 4;
    int barW      = (barCount > 0) ? (barAreaW - (barCount - 1) * barGap) / barCount : barAreaW;

    int maxPm25 = 1;
    for (int i = 0; i < barCount; i++)
      if (aqiData.pm25Forecast[i].maxVal > maxPm25) maxPm25 = aqiData.pm25Forecast[i].maxVal;

    for (int i = 0; i < barCount; i++) {
      ForecastDay& f = aqiData.pm25Forecast[i];
      int x = barStartX + i * (barW + barGap);
      int maxH = (int)((float)f.maxVal / maxPm25 * (barAreaH - 14));
      int avgH = (int)((float)f.avg    / maxPm25 * (barAreaH - 14));

      display.drawRect(x, barStartY + barAreaH - 14 - maxH, barW, max(maxH, 1), GxEPD_BLACK);
      display.fillRect(x, barStartY + barAreaH - 14 - avgH, barW, max(avgH, 1), GxEPD_BLACK);

      char dayLabel[3];
      strncpy(dayLabel, f.day + 3, 2);
      dayLabel[2] = '\0';
      display.setFont(NULL);
      display.setTextSize(1);
      int16_t tx, ty; uint16_t tw, th;
      display.getTextBounds(dayLabel, 0, 0, &tx, &ty, &tw, &th);
      display.setCursor(x + (barW - tw) / 2, barStartY + barAreaH - 10);
      display.print(dayLabel);
    }

    // PM2.5 图例
    display.fillRect(barStartX, barStartY + barAreaH + 2, 6, 5, GxEPD_BLACK);
    drawCN(barStartX + 9, barStartY + barAreaH + 1, "均值", false, u8g2_font_wqy12_t_gb2312);
    display.drawRect(barStartX + 60, barStartY + barAreaH + 2, 6, 5, GxEPD_BLACK);
    drawCN(barStartX + 69, barStartY + barAreaH + 1, "最大", false, u8g2_font_wqy12_t_gb2312);

    // ---------- UV 紫外线小图表 ----------
    int uvX = 272, uvY = 204, uvW = W - uvX - 6, uvH = barAreaH;
    display.drawRect(uvX, uvY, uvW, uvH, GxEPD_BLACK);

    int uvCount  = min(aqiData.uviForecastCount, 6);
    int uvBarGap = 3;
    int uvBarW   = (uvCount > 0) ? (uvW - 6 - (uvCount - 1) * uvBarGap) / uvCount : uvW;

    int maxUvi = 1;
    for (int i = 0; i < uvCount; i++)
      if (aqiData.uviForecast[i].maxVal > maxUvi) maxUvi = aqiData.uviForecast[i].maxVal;

    for (int i = 0; i < uvCount; i++) {
      ForecastDay& u = aqiData.uviForecast[i];
      int x = uvX + 3 + i * (uvBarW + uvBarGap);
      int mH = (int)((float)u.maxVal / maxUvi * (uvH - 16));
      int aH = (int)((float)u.avg   / maxUvi * (uvH - 16));

      if (mH > 0) display.drawRect(x, uvY + uvH - 12 - mH, uvBarW, mH, GxEPD_BLACK);
      if (aH > 0) display.fillRect(x, uvY + uvH - 12 - aH, uvBarW, aH, GxEPD_BLACK);

      char dayL[3];
      strncpy(dayL, u.day + 3, 2);
      dayL[2] = '\0';
      display.setFont(NULL);
      display.setTextSize(1);
      display.setCursor(x, uvY + uvH - 10);
      display.print(dayL);
    }

    // ---------- 最底部状态栏 (286-300) [上方留出少许清爽白边] ----------
    display.fillRect(0, H - 14, W, 14, GxEPD_BLACK);
    display.setFont(NULL);
    display.setTextSize(1);
    display.setTextColor(GxEPD_WHITE);
    display.setCursor(6, H - 11);
    display.print("aqicn.org | ESP32-S3");

    char geoBot[24];
    snprintf(geoBot, sizeof(geoBot), "%.2fN %.2fE", aqiData.lat, aqiData.lon);
    int16_t tx, ty; uint16_t tw, th;
    display.getTextBounds(geoBot, 0, 0, &tx, &ty, &tw, &th);
    display.setCursor(W - tw - 6, H - 11);
    display.print(geoBot);

  } while (display.nextPage());
}

// ==================== 显示错误信息 ====================
void drawError(const char* msg) {
  display.firstPage();
  do {
    display.fillScreen(GxEPD_WHITE);
    display.drawRect(5, 5, display.width() - 10, display.height() - 10, GxEPD_BLACK);
    display.setFont(NULL);
    display.setTextColor(GxEPD_BLACK);
    display.setTextSize(2);
    display.setCursor(20, 40);
    display.print("ERROR");
    display.setTextSize(1);
    display.setCursor(20, 80);
    display.print(msg);
    display.setCursor(20, 100);
    display.print("Will retry in 30s...");
  } while (display.nextPage());
}

// ==================== 自动选择横屏方向 ====================
void chooseLandscapeRotation() {
  int candidates[4] = {1, 3, 0, 2};
  int chosen = 1;
  for (int i = 0; i < 4; i++) {
    display.setRotation(candidates[i]);
    if (display.width() > display.height()) {
      chosen = candidates[i];
      break;
    }
  }
  if (ROTATION_FLIP) {
    chosen = (chosen + 2) % 4;
    display.setRotation(chosen);
  }
  Serial.printf("Rotation = %d -> W=%d H=%d\n", chosen, display.width(), display.height());
}

// ==================== SETUP ====================
void setup() {
  Serial.begin(115200);
  delay(1000);
  Serial.println("\n=== ESP32-S3 Air Quality Monitor (v2.1) ===");

  SPI.begin(EPD_CLK, -1, EPD_MOSI, EPD_CS);

  display.init(115200, true, 2, false);
  chooseLandscapeRotation();

  u8f.begin(display);
  u8f.setFontMode(1);
  u8f.setFontDirection(0);

  // 启动画面
  display.firstPage();
  do {
    display.fillScreen(GxEPD_WHITE);
    drawCNCentered(display.width() / 2, 90, "空气质量监测站", false, u8g2_font_wqy16_t_gb2312);
    drawCNCentered(display.width() / 2, 130, "正在连接 WiFi...", false, u8g2_font_wqy14_t_gb2312);
  } while (display.nextPage());

  connectWiFi();

  if (fetchAqiData()) {
    drawUI();
  } else {
    drawError("Failed to fetch data");
  }

  display.powerOff();
}

// ==================== LOOP ====================
void loop() {
  delay(UPDATE_INTERVAL_MS);

  Serial.println("Refreshing data...");

  if (WiFi.status() != WL_CONNECTED) {
    connectWiFi();
  }

  if (fetchAqiData()) {
    display.init(115200, true, 2, false);
    chooseLandscapeRotation();
    drawUI();
    display.powerOff();
    Serial.println("Screen updated successfully.");
  } else {
    Serial.println("Data fetch failed, will retry next cycle.");
  }
}
Code Walkthrough
Step one: connectWiFi() does the standard WiFi connection, retrying 40 times (20 seconds). On timeout it doesn’t hang — it moves on so that even offline you still see the error message instead of a black screen.
Step two: fetchAqiData() uses HTTPClient to hit AQICN’s /feed/@cityID/ endpoint, then parses the returned JSON with ArduinoJson’s JsonDocument, filling the AqiData struct field by field — including the current 12 metrics and the multi-day PM2.5/PM10/UV forecast arrays.
Step three: drawUI() is the heart of the rendering. It lays out the screen block by block in the order “title bar → big AQI box → 12-metric grid → forecast bar chart → bottom status bar.” Every block’s coordinates are hardcoded pixel values, which makes it easy to tweak the layout to your taste.
Step four: Chinese rendering rides on the U8g2_for_Adafruit_GFX bridge. The drawCN family of functions wraps both white-on-black and black-on-white modes in one place, so you’re not resetting colors at every call site.
Step five: loop() refreshes once every 30 minutes — it re-initializes the panel, calls drawUI(), then immediately powerOff()s the panel once it’s done. That’s the key to keeping an e-paper setup power-sipping and panel-friendly: when you’re not refreshing, there’s no need to feed it power at all.
Troubleshooting
Don’t panic — about 80% of issues come down to a handful of usual suspects:
Panel stuck blank or garbled: Check wiring first — especially whether the four control lines CS, DC, RES, and BUSY are in the wrong order. Then confirm the driver class GxEPD2_420_GYE042A87 in display.init() actually matches the real model of the panel in your hand — a model mismatch scrambles the timing.
Chinese shows up as boxes or mojibake: That means U8g2_for_Adafruit_GFX didn’t initialize correctly. Make sure u8f.begin(display) is called after display.init(), and confirm that the font set you’re using (e.g. u8g2_font_wqy14_t_gb2312) actually contains the characters you’re trying to display.
WiFi won’t connect: Confirm the dev board only supports 2.4GHz, not 5GHz WiFi. Also check whether your SSID or password has Chinese characters or special characters causing escaping issues.
API data comes back as all zeros: Most likely API_TOKEN wasn’t applied for or was typed wrong. It could also be a wrong city ID (like @14370) in API_URL — open that URL directly in a browser first to confirm you get valid JSON back.
Image is upside down: Change ROTATION_FLIP in the code from 0 to 1 and reflash — no rewiring needed.
**Compile throws “out of space / region app' overflowed":** The Chinese font tables blew past the default partition. Per the "Flashing Config: Partition Scheme" section above, switch Partition SchemetoHuge APP (3MB No OTA/1MB SPIFFS)` and recompile.
FAQ
Q: Can I swap the ESP32-S3 for a regular ESP32? A: Yes. As long as the pins you’ve chosen support SPI and aren’t special-purpose pins already claimed by the board (like the Flash pins), just change the six EPD_* macros in the code to the GPIO numbers of your actual wiring — the rest of the code doesn’t need to change.
Q: The GxEPD2_420_GYE042A87 driver class doesn’t match my panel — what now? A: Look up the matching driver class name for your model in the GxEPD2 GitHub repo and replace that one display definition line. The rest of the drawing code usually needs no changes.
Q: Why does each refresh take several seconds — can it be faster? A: A full refresh on a black-and-white e-paper panel is inherently slow — that’s a hardware trait, not a code problem. If you only need to update a few numbers, you can look into GxEPD2’s partial update API, but expect ghosting.
Q: Is the AQICN API free quota enough? A: The free personal Token from AQICN is typically good for 1000 requests per minute. This project only hits the API once every 30 minutes, so you’re well within the limit — no worries.
Q: Roughly how much power does the ESP32-S3 draw when it’s not refreshing? A: The code doesn’t use deep sleep — loop() just spins on delay(), so in practice you’re looking at tens of milliamps. For a battery-powered build, swap delay(UPDATE_INTERVAL_MS) for esp_deep_sleep and you can bring that down to the microamp range.
Q: The panel never refreshes, but the serial monitor says the data fetch succeeded — what gives? A: Check that the display.firstPage()/nextPage() loop inside drawUI() isn’t being interrupted by a mid-loop return. GxEPD2 requires this loop to run all the way through once before it actually pushes the frame to the panel.
Going Further
- Read a local city list off an SD card and rotate through a multi-city carousel.
- Add a button: short press for a manual refresh, long press to drop into deep sleep and save power.
- Replace the 30-minute update interval with an ambient light sensor, so the refresh rate dials itself down automatically once it gets dark.